OPEN-SOURCE SCRIPT
Updated Candle Bias Forecast
Candle Bias Forecast Indicator
Description:
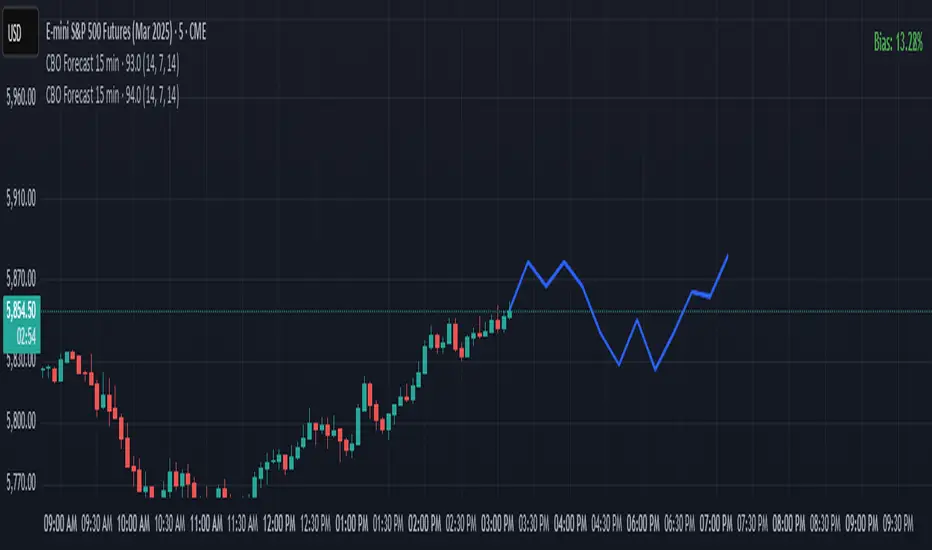
The Candle Bias Forecast Indicator is an original multi‐timeframe analysis tool that generates price forecast levels based on the difference between candle biases on two different timeframes. It uses innovative calculations to provide potential forecast levels that align with current price action.
How It Works:
1. Candle Bias Calculation:
For each candle, the indicator computes a “candle bias” using the formula:
candleBias = (((open + close)/2 - (high + low)/2) + ((close - open)/(high - low)))/2
This measure captures both the positioning of the candle’s body within its range and the normalized move from open to close.
2. Multi-Timeframe Analysis:
The script uses multiple timeframe pairs (e.g., 5-minute vs. 30-minute, 10-minute vs. 60-minute, etc.). For each pair, the bias is computed on the lower timeframe and on the higher timeframe.
3. Normalization with ATR:
To translate the dimensionless bias difference into price terms, the indicator multiplies the difference by the lower timeframe’s Average True Range (ATR). This scales the forecast adjustment to current market volatility.
4. Forecast Computation:
The forecast level for each pair is then calculated as:
forecast = close + (lowerTF_ATR * (lowerTF_bias - higherTF_bias))
This yields forecast levels that are plotted on the chart and connected by lines for a visual guide.
How to Use:
- Visual Confirmation: Add the indicator to your 1 to 15 minute chart to see forecast levels overlaid on the price.
- Supplementary Analysis: Use these forecast levels as an additional tool alongside your other analysis methods. They can help indicate potential support/resistance areas or directional bias.
Important Notes:
- Not a Standalone Signal: This indicator is intended to supplement your analysis. Always combine it with other tools and sound risk management practices.
- For Educational & Research Use: The indicator is provided “as is” without any guarantee of performance. It is designed to illustrate an innovative approach to multi-timeframe analysis.
- Disclaimer: Past performance is not indicative of future results. Use this tool at your own risk.
By combining candle bias with ATR-based normalization and multi-timeframe analysis, this indicator offers a unique perspective on market dynamics that can enrich your trading strategy.
---
*This is an original script designed to add value to the TradingView community. Please test and validate its outputs thoroughly before using it in live trading.*
Description:
The Candle Bias Forecast Indicator is an original multi‐timeframe analysis tool that generates price forecast levels based on the difference between candle biases on two different timeframes. It uses innovative calculations to provide potential forecast levels that align with current price action.
How It Works:
1. Candle Bias Calculation:
For each candle, the indicator computes a “candle bias” using the formula:
candleBias = (((open + close)/2 - (high + low)/2) + ((close - open)/(high - low)))/2
This measure captures both the positioning of the candle’s body within its range and the normalized move from open to close.
2. Multi-Timeframe Analysis:
The script uses multiple timeframe pairs (e.g., 5-minute vs. 30-minute, 10-minute vs. 60-minute, etc.). For each pair, the bias is computed on the lower timeframe and on the higher timeframe.
3. Normalization with ATR:
To translate the dimensionless bias difference into price terms, the indicator multiplies the difference by the lower timeframe’s Average True Range (ATR). This scales the forecast adjustment to current market volatility.
4. Forecast Computation:
The forecast level for each pair is then calculated as:
forecast = close + (lowerTF_ATR * (lowerTF_bias - higherTF_bias))
This yields forecast levels that are plotted on the chart and connected by lines for a visual guide.
How to Use:
- Visual Confirmation: Add the indicator to your 1 to 15 minute chart to see forecast levels overlaid on the price.
- Supplementary Analysis: Use these forecast levels as an additional tool alongside your other analysis methods. They can help indicate potential support/resistance areas or directional bias.
Important Notes:
- Not a Standalone Signal: This indicator is intended to supplement your analysis. Always combine it with other tools and sound risk management practices.
- For Educational & Research Use: The indicator is provided “as is” without any guarantee of performance. It is designed to illustrate an innovative approach to multi-timeframe analysis.
- Disclaimer: Past performance is not indicative of future results. Use this tool at your own risk.
By combining candle bias with ATR-based normalization and multi-timeframe analysis, this indicator offers a unique perspective on market dynamics that can enrich your trading strategy.
---
*This is an original script designed to add value to the TradingView community. Please test and validate its outputs thoroughly before using it in live trading.*
Release Notes
Now uses 3 period moving average of CBORelease Notes
normalize candle bias valuesRelease Notes
uses higher timeframe ATR nowRelease Notes
fix broken codeRelease Notes
long-term averagingRelease Notes
color change optionRelease Notes
fix Release Notes
fixRelease Notes
option to change period and bias displayRelease Notes
bias makes sense nowRelease Notes
fix bias calculationRelease Notes
ROC, volume and divergence calculationsRelease Notes
use lower timeframe atrOpen-source script
In true TradingView spirit, the creator of this script has made it open-source, so that traders can review and verify its functionality. Kudos to the author! While you can use it for free, remember that republishing the code is subject to our House Rules.
Disclaimer
The information and publications are not meant to be, and do not constitute, financial, investment, trading, or other types of advice or recommendations supplied or endorsed by TradingView. Read more in the Terms of Use.
Open-source script
In true TradingView spirit, the creator of this script has made it open-source, so that traders can review and verify its functionality. Kudos to the author! While you can use it for free, remember that republishing the code is subject to our House Rules.
Disclaimer
The information and publications are not meant to be, and do not constitute, financial, investment, trading, or other types of advice or recommendations supplied or endorsed by TradingView. Read more in the Terms of Use.