OPEN-SOURCE SCRIPT
previous day H/L 15 min backtester
works on 15 min and 5 min charts.
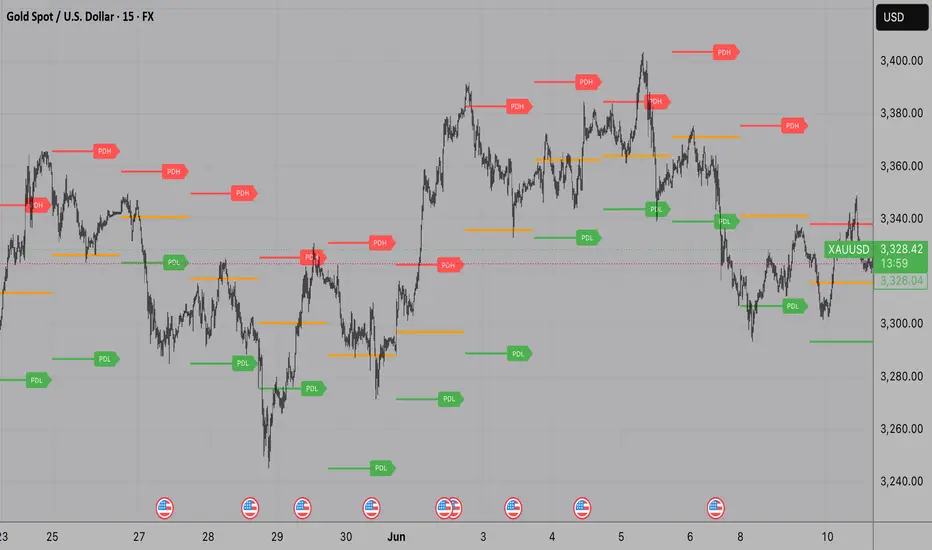
This indicator visualizes critical daily price levels to support intraday and swing trading decisions. Specifically, it calculates and displays the Previous Day High (PDH), Previous Day Low (PDL), and the midpoint (PDM) — the average of the high and low — based on price data from the prior trading day.
Each level line is anchored to start precisely at 6 PM New York time, marking the start of the trading day for many major markets. The lines then extend forward for a fixed duration, ensuring these key support and resistance zones remain visible well into the current trading session, giving traders a persistent frame of reference.
This persistent extension helps traders monitor price interaction with important levels throughout the day without cluttering the chart with obsolete lines. Labels indicating PDH, PDL, and PDM are displayed clearly on the left or right side of the chart, customizable to user preference.
By using this indicator, traders can better gauge potential reversal points, breakout zones, and price consolidation areas grounded on significant daily market structure, improving timing and risk management in their trading strategies.
Open-source script
In true TradingView spirit, the creator of this script has made it open-source, so that traders can review and verify its functionality. Kudos to the author! While you can use it for free, remember that republishing the code is subject to our House Rules.
Disclaimer
The information and publications are not meant to be, and do not constitute, financial, investment, trading, or other types of advice or recommendations supplied or endorsed by TradingView. Read more in the Terms of Use.