OPEN-SOURCE SCRIPT
Fibonacci Buy /Sell Signals
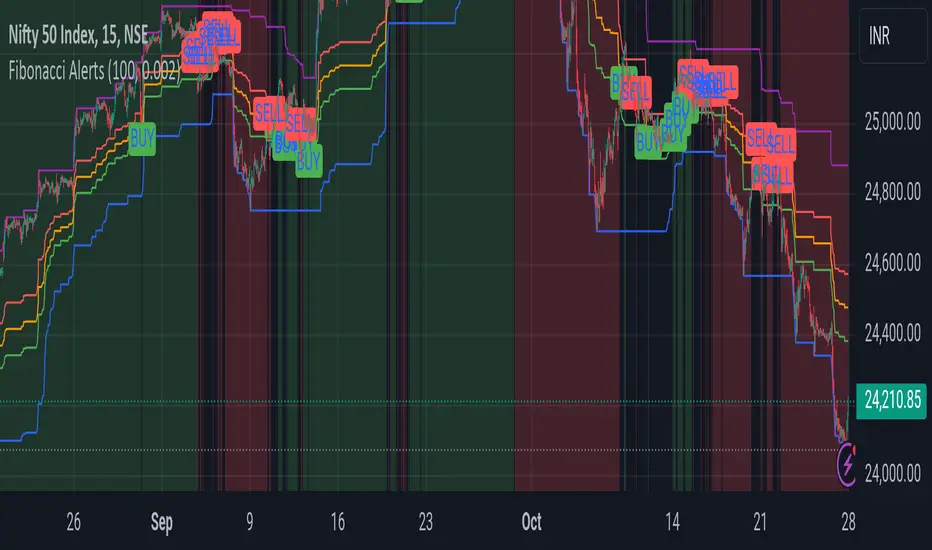
Here is a Fibonacci-based Buy/Sell Indicator using retracement levels for potential support and resistance zones. This indicator plots Fibonacci levels and provides buy/sell signals based on price interaction with these levels.
Fibonacci Levels:
Highest high and lowest low over the lookback period.
Key levels: 38.2% (retracement), 50% (midpoint), 61.8% (strong retracement).
Buy Signal: When the price crosses above the 61.8% Fibonacci level (bullish).
Sell Signal: When the price crosses below the 38.2% Fibonacci level (bearish).
Open-source script
In true TradingView spirit, the creator of this script has made it open-source, so that traders can review and verify its functionality. Kudos to the author! While you can use it for free, remember that republishing the code is subject to our House Rules.
Disclaimer
The information and publications are not meant to be, and do not constitute, financial, investment, trading, or other types of advice or recommendations supplied or endorsed by TradingView. Read more in the Terms of Use.