OPEN-SOURCE SCRIPT
Rahu Cycle

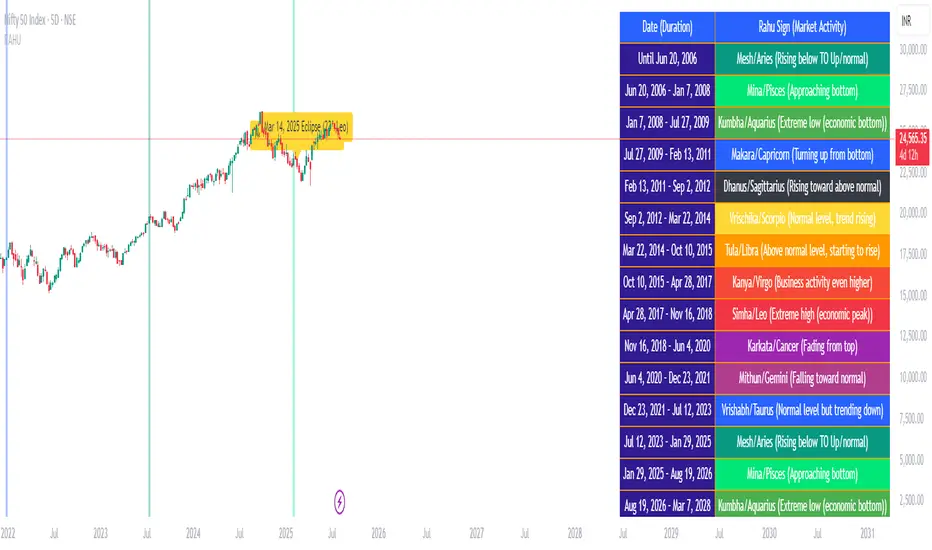
This script is showing special “Rahu times” for markets like old man watch sun for rain or farming. It make colorful boxes on chart say, “from this date to that date, market like this sign.” Like, maybe market very good, or very bad, or going up, or down, just like weather season change.
You see table on chart, color, big words - it tell when Rahu (shadow planet in Indian myth) move from one place to next. Say “Mesh/Aries: Market going up, Pisces: market falling.” It’s like old people telling “From June to July, rain come, crop grow.”
It remember big crash, recession, boom - it show label on those dates, so you see “oh, here big problem come.” Like “2008: crash, 2015: China problem, 2009: market at lowest.”
It make chart background colored also, so you know which Rahu phase now, like green for very bad, red for super boom—just like traffic light for market activity.
All these things come in TradingView chart as colored boxes and notes, you don’t need read big book. Just look, see color, understand—market going up, or danger coming, or safe time.
So, this script… make market ups-and-downs simple for you. Rahu go from one sign to next, market change color, you see, you decide. No need expert—just see color, follow cycle, stay safe.
Open-source script
In true TradingView spirit, the creator of this script has made it open-source, so that traders can review and verify its functionality. Kudos to the author! While you can use it for free, remember that republishing the code is subject to our House Rules.
Disclaimer
The information and publications are not meant to be, and do not constitute, financial, investment, trading, or other types of advice or recommendations supplied or endorsed by TradingView. Read more in the Terms of Use.