OPEN-SOURCE SCRIPT
Hi-Lo World
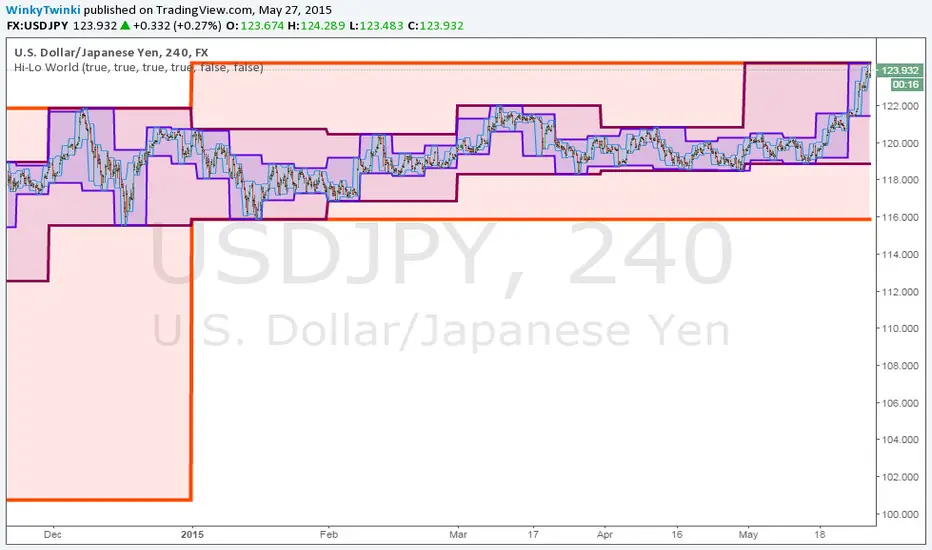
This script plots the highs/lows from multiple timeframes onto the same chart to help you spot the prevailing long-term, medium-term and short-term trends.
List of timeframes included:
You can select which timeframes to plot by editing the inputs on the Format Object dialog.
List of timeframes included:
- Year
- Month
- Week
- Day
- 4 Hour
- Hour
You can select which timeframes to plot by editing the inputs on the Format Object dialog.
Open-source script
In true TradingView spirit, the creator of this script has made it open-source, so that traders can review and verify its functionality. Kudos to the author! While you can use it for free, remember that republishing the code is subject to our House Rules.
Disclaimer
The information and publications are not meant to be, and do not constitute, financial, investment, trading, or other types of advice or recommendations supplied or endorsed by TradingView. Read more in the Terms of Use.