OPEN-SOURCE SCRIPT
Candle vs 8 SMA - Red & Green
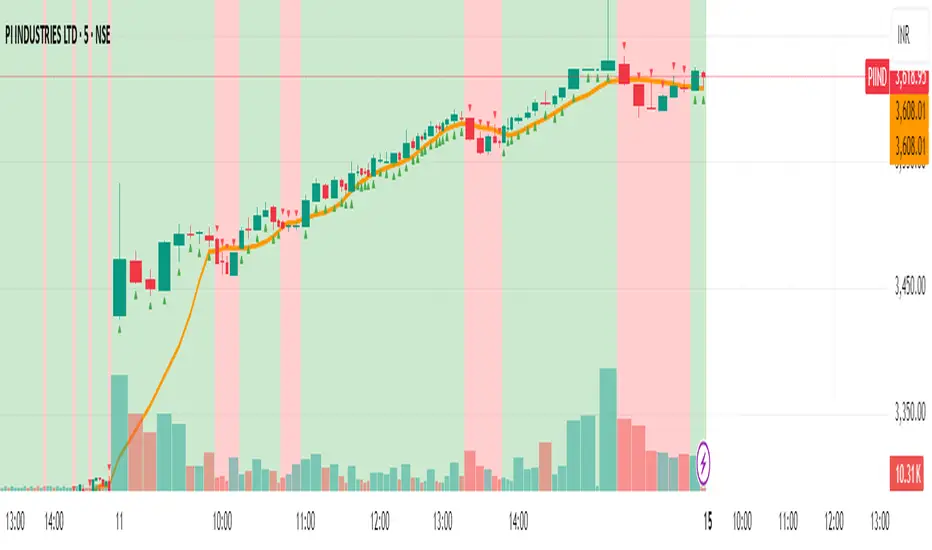
📈 Script Name: Candle vs 8 SMA – Red & Green
This TradingView Pine Script visually compares each candle's close price to the 8-period Simple Moving Average (SMA) and highlights the chart accordingly:
🔍 What It Does:
Calculates the 8-period SMA
sma8 = ta.sma(close, 8)
This line computes the average of the last 8 closing prices to smooth out short-term fluctuations.
Plots the SMA Line
Orange line shown on the chart.
Helps you visually track the short-term trend.
Identifies Candle Position
candleAbove: true if the candle’s close is above the SMA
candleBelow: true if the candle’s close is below the SMA
Highlights Background
If the close is above the 8 SMA → Green background (indicating bullish behavior)
If the close is below the 8 SMA → Red background (indicating bearish behavior)
Plots Triangle Shapes
Green triangle below candle when above the SMA
Red triangle above candle when below the SMA
Helps quickly identify conditions at a glance
🧠 Why Use It?
This script is useful for:
Intraday trend confirmation
Spotting momentum shifts
Visual clarity on how price reacts to a dynamic support/resistance (SMA)
Aiding quick decisions for scalping or intraday trades
Open-source script
In true TradingView spirit, the creator of this script has made it open-source, so that traders can review and verify its functionality. Kudos to the author! While you can use it for free, remember that republishing the code is subject to our House Rules.
Disclaimer
The information and publications are not meant to be, and do not constitute, financial, investment, trading, or other types of advice or recommendations supplied or endorsed by TradingView. Read more in the Terms of Use.