OPEN-SOURCE SCRIPT
Crypto$ure EMA with 4H Trend Table
The Crypto URE EMA indicator provides a clear, multi-timeframe confirmation setup to help you align your shorter-term trades with the broader market trend.
Key Features:
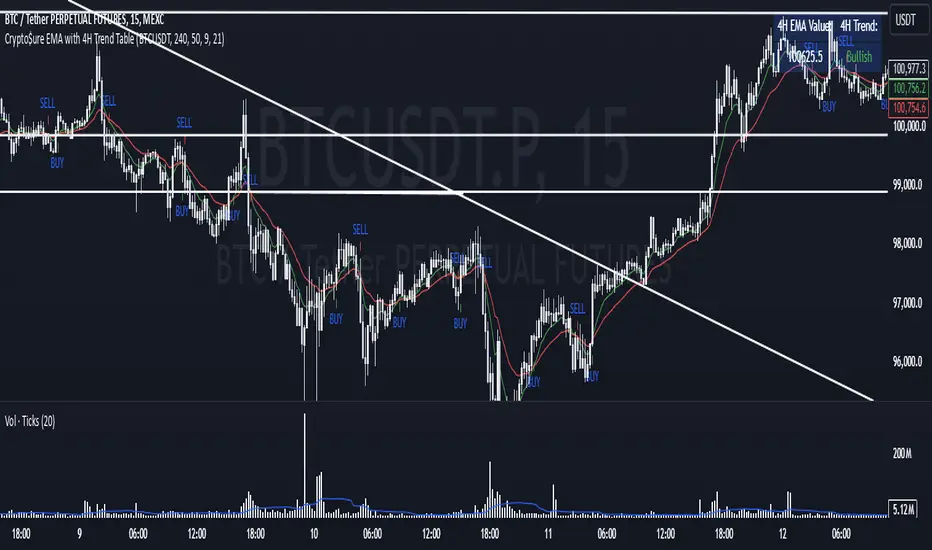
4-Hour EMA Trend Insight:
A table, displayed at the top-right corner of your chart, shows the current 4-hour EMA value and whether the 4-hour trend is Bullish, Bearish, or Neutral. This gives you a reliable, higher-timeframe perspective, making it easier to understand the general market direction.
Lower Timeframe Signals (e.g., 25m or 15m):
On your chosen chart timeframe, the indicator plots two EMAs (Fast and Slow).
A Buy Signal (an up arrow) appears when the Fast EMA crosses above the Slow EMA, indicating potential upward momentum.
A Sell Signal (a down arrow) appears when the Fast EMA crosses below the Slow EMA, indicating potential downward momentum.
Manual Confirmation for Better Accuracy:
While the Buy/Sell signals come directly from the shorter timeframe, you can use the 4-hour trend information from the table to confirm or filter these signals. For example, if the 4-hour trend is Bullish, the Buy signals on the shorter timeframe may carry more weight. If it’s Bearish, then the Sell signals might be more reliable.
How to Use:
Add the CryptoURE EMA indicator to your chart.
Check the top-right table to see the current 4-hour EMA trend.
Watch for Buy (up arrow) or Sell (down arrow) signals on your current timeframe.
For added confidence, consider taking Buy signals only when the 4-hour trend is Bullish and Sell signals when the 4-hour trend is Bearish.
Note:
This indicator does not generate trading orders. Instead, it provides actionable insights to help guide your discretionary decision-making. Always consider additional market context, risk management practices, and personal trading rules before acting on any signal.
Key Features:
4-Hour EMA Trend Insight:
A table, displayed at the top-right corner of your chart, shows the current 4-hour EMA value and whether the 4-hour trend is Bullish, Bearish, or Neutral. This gives you a reliable, higher-timeframe perspective, making it easier to understand the general market direction.
Lower Timeframe Signals (e.g., 25m or 15m):
On your chosen chart timeframe, the indicator plots two EMAs (Fast and Slow).
A Buy Signal (an up arrow) appears when the Fast EMA crosses above the Slow EMA, indicating potential upward momentum.
A Sell Signal (a down arrow) appears when the Fast EMA crosses below the Slow EMA, indicating potential downward momentum.
Manual Confirmation for Better Accuracy:
While the Buy/Sell signals come directly from the shorter timeframe, you can use the 4-hour trend information from the table to confirm or filter these signals. For example, if the 4-hour trend is Bullish, the Buy signals on the shorter timeframe may carry more weight. If it’s Bearish, then the Sell signals might be more reliable.
How to Use:
Add the Crypto
Check the top-right table to see the current 4-hour EMA trend.
Watch for Buy (up arrow) or Sell (down arrow) signals on your current timeframe.
For added confidence, consider taking Buy signals only when the 4-hour trend is Bullish and Sell signals when the 4-hour trend is Bearish.
Note:
This indicator does not generate trading orders. Instead, it provides actionable insights to help guide your discretionary decision-making. Always consider additional market context, risk management practices, and personal trading rules before acting on any signal.
Open-source script
In true TradingView spirit, the creator of this script has made it open-source, so that traders can review and verify its functionality. Kudos to the author! While you can use it for free, remember that republishing the code is subject to our House Rules.
Disclaimer
The information and publications are not meant to be, and do not constitute, financial, investment, trading, or other types of advice or recommendations supplied or endorsed by TradingView. Read more in the Terms of Use.