OPEN-SOURCE SCRIPT
Updated RSI Divergence Ultimate
Here it is Everyone - What was once hidden is now revealed
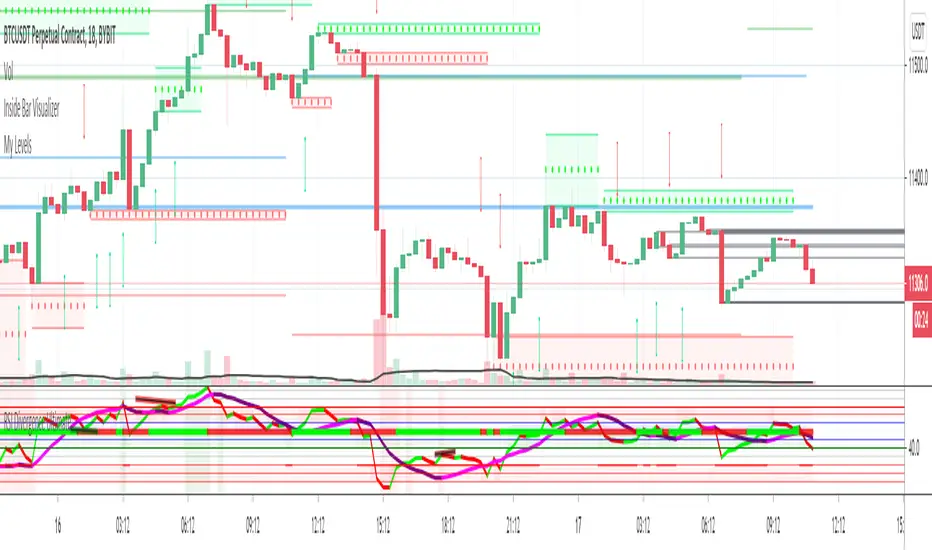
This is the Ultimate RSI Divergence Indicator
Not only does it plot Regular and Hidden Divergence lines for an RSI smoothed by an EMA and for its Signal Line
The RSI can be set to change color with direction or can be set as single color with or with out OB / OS highlights
Color Changing RSI helps when trading Multiple Time Frames as you can look for confluence in the direction of RSI
Included options for the Signal Line include;
Various calculations EMA, SMA and Linear Regression which provides very accurate signal line crossover signals
Color Changing with direction
Second RSI with different Length
Multi Time Frame RSI
Bollinger Bands applied to the RSI
RSI Stochastic that has been compressed to fit into RSI OB / OS so that it doesnt compress the RSI when in these regions
There are also Background Highlights (thanks to Chris Moody) for when the RSI Stochastic moves into OB / OS and crosses its signal line
There are plenty of Alerts for signals with more complex alerts coming soon
I have also added Hima Reddy's Power Zones for support and resistance so now you can also
Take full advantage of trading; signal line crosses, 50 crosses and Power Zone RSI support and resistance and much more
The divergence script is thanks to RicardoSantos, I've just adjusted it to suite my indicator
Remember that divergences work best when traded with the trend or very late in a trend when going against the trend
Release Notes
Added option to reverse the colors for RSI Stochastic OB / OSRelease Notes
Adjusted colors for RSI Stoch. OB / OSRelease Notes
Changed Menu and how RSI Timeframes are selectedAdded Choppiness Index Overlay and single bar Histogram colored according to significant levels
Added further highlights as RSI moves into Power Zones or consolidation zone
Release Notes
Added MFI and background highlights when MFI is OB/OS Release Notes
Set MFI OB/OS Highlights as defaultRelease Notes
Optional Offset for divergences to where earliest entry can take placeAdjusted Alerts to be easier to see when selecting
Release Notes
Mid Line Color According to RSI Above or Below Signal Line 1Release Notes
Set to optimal settings Added menu for adjustment of MFI OB /OS thresholds for Background Highlights
Tips for use;
Use Hima Ready levels for S/R of RSI
Look for RSI to cross Signal Line (Center Line Color) and Signal Line Direction for confirmation
Look for confluence with your entry indicator
Use appropriate Risk Management
Release Notes
Fixed Fault with signal line 2 - RSIAdded color OB / OS highlights of RSI 5 on standard RSI - Shows exhaustion
Changed some defaults
Release Notes
Added Alerts for RSI crossing into Over Bought / Over Sold regions & RSI Crossing the 50 / Mid LineAdded Highlights for when RSI Crosses the 50 / Mid Line - Sorry Folks I had to remove the choppiness index to be able to do this
Release Notes
Added more Alerts Please note that alerts are not setups in themselves, they are only there so you can be aware to start looking for setups
Open-source script
In true TradingView spirit, the creator of this script has made it open-source, so that traders can review and verify its functionality. Kudos to the author! While you can use it for free, remember that republishing the code is subject to our House Rules.
Disclaimer
The information and publications are not meant to be, and do not constitute, financial, investment, trading, or other types of advice or recommendations supplied or endorsed by TradingView. Read more in the Terms of Use.