OPEN-SOURCE SCRIPT
Higher Timeframe TrendMap [BigBeluga]
🔵HTF TrendMap [BigBeluga]
A powerful visual overlay that brings higher timeframe market structure directly onto your intraday chart.
This tool maps directional bias, trend strength, and dynamic range boundaries from a user-selected HTF (like Daily or 4H), offering a real-time confluence layer for scalpers, day traders, and swing traders.
By plotting the evolving average (HL2), it acts as a volatility-weighted trend anchor, allowing you to align lower timeframe entries with higher timeframe intent.
Technical Overview:
At the close of each higher timeframe (HTF) candle, the indicator stores the high, low, and calculates the HL2 midpoint. These values are then referenced on the lower timeframe chart to plot trend direction and price boundaries.
🔵 KEY FEATURES
🔵 HOW TO USE
🔵 CONCLUSION
HTF TrendMap [BigBeluga] provides a clean, data-rich layer of higher timeframe context to any chart. With adaptive trend coloring, volatility mapping, and real-time data labeling, it enables traders to stay in sync with macro structure while executing on the micro.
A powerful visual overlay that brings higher timeframe market structure directly onto your intraday chart.
This tool maps directional bias, trend strength, and dynamic range boundaries from a user-selected HTF (like Daily or 4H), offering a real-time confluence layer for scalpers, day traders, and swing traders.
By plotting the evolving average (HL2), it acts as a volatility-weighted trend anchor, allowing you to align lower timeframe entries with higher timeframe intent.
Technical Overview:
At the close of each higher timeframe (HTF) candle, the indicator stores the high, low, and calculates the HL2 midpoint. These values are then referenced on the lower timeframe chart to plot trend direction and price boundaries.
🔵 KEY FEATURES
- Maps the selected higher timeframe (HTF) (e.g., Daily) onto your current chart.
- At the close of each HTF candle, it starts to calculate and store the highest, lowest, and average (HL2) price levels.
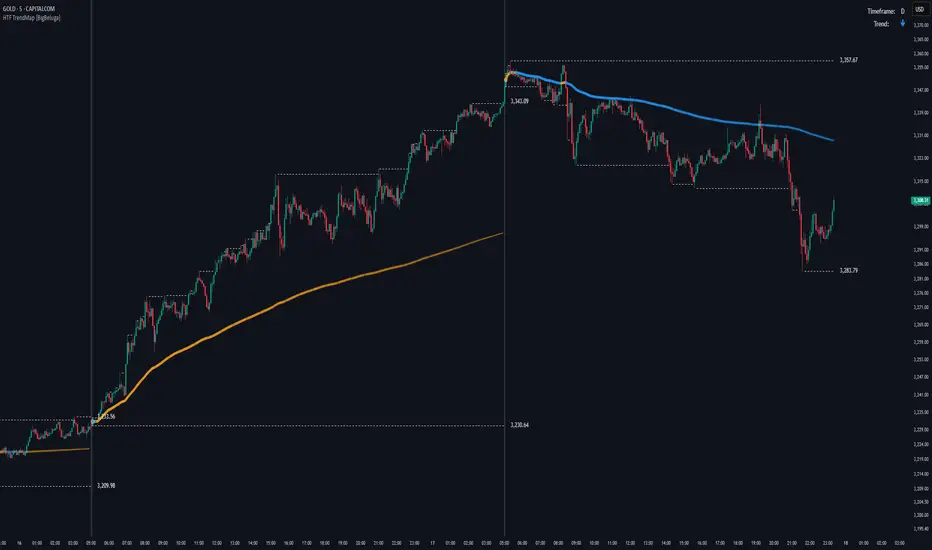
- The average (HL2) value is treated as the HTF trend baseline—plotted in orange for uptrend, blue for downtrend.
- Visual curve thickens and fades to show progress through the HTF period (stronger color = fresher data).
- Horizontal dashed lines show HTF high and low levels that persist until the next period closes.
- On every HTF close, two price labels are printed for the high and low levels.
- Vertical separators visually mark the start of each HTF candle for easy structural recognition.
- A real-time dashboard shows selected HTF, current trend direction (🢁/🢃), and updates dynamically.
🔵 HOW TO USE
- Use the HTF average line as a bias filter—only long when the trend is up (orange), short when down (blue).
- HTF high/low labels help identify key breakout or rejection zones.
- Combine with intraday systems or reversal tools for multi-timeframe confluence setups.
- Ideal for scalpers and swing traders who rely on HTF momentum shifts.
🔵 CONCLUSION
HTF TrendMap [BigBeluga] provides a clean, data-rich layer of higher timeframe context to any chart. With adaptive trend coloring, volatility mapping, and real-time data labeling, it enables traders to stay in sync with macro structure while executing on the micro.
Open-source script
In true TradingView spirit, the creator of this script has made it open-source, so that traders can review and verify its functionality. Kudos to the author! While you can use it for free, remember that republishing the code is subject to our House Rules.
🔵Gain access to our powerful tools : bigbeluga.com
🔵Join our free discord for updates : bigbeluga.com/discord
All scripts & content provided by BigBeluga are for informational & educational purposes only.
🔵Join our free discord for updates : bigbeluga.com/discord
All scripts & content provided by BigBeluga are for informational & educational purposes only.
Disclaimer
The information and publications are not meant to be, and do not constitute, financial, investment, trading, or other types of advice or recommendations supplied or endorsed by TradingView. Read more in the Terms of Use.