OPEN-SOURCE SCRIPT
Multi timeframe trend
DESCRIPTION
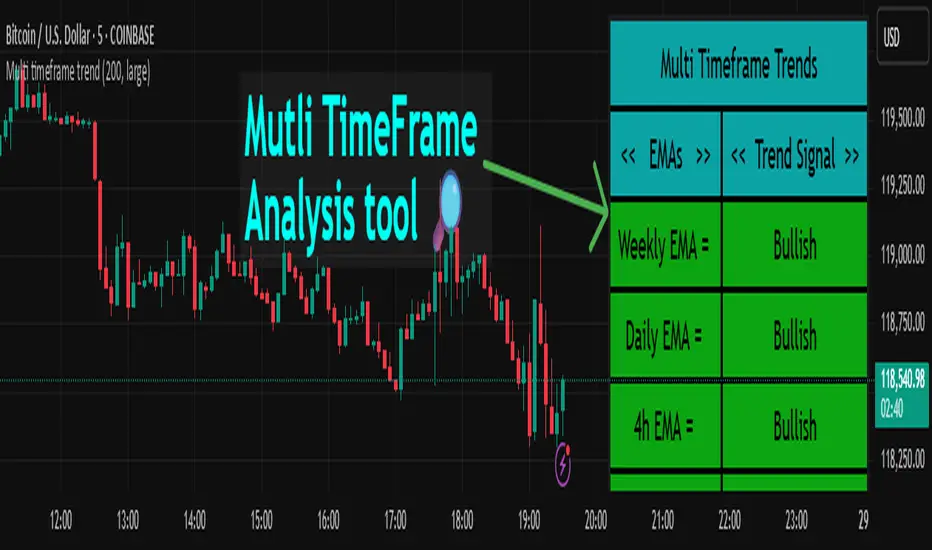
This indicator, Multi Timeframe Trend, is a powerful tool designed to give traders a comprehensive overview of market trends across multiple timeframes using a single, customizable Exponential Moving Average (EMA). It visually displays whether the price is trading above or below the EMA on each timeframe, helping traders quickly determine the dominant trend at a glance.
The real-time dashboard is plotted directly on your chart and color-coded to show bullish (green) or bearish (red) conditions per timeframe, from 15 minutes to 1 week. It is especially helpful for identifying trend alignment across multiple timeframes—an essential component of many professional trading strategies.
USER INPUTS
* Enter the EMA length – Adjust the EMA period used in the trend calculation (default: 200)
* Table Size – Choose how large the on-chart table appears: "tiny", "small", "normal", or "large"
INDICATOR LOGIC
* The indicator calculates the EMA for each of the following timeframes: 1W, 1D, 4H, 1H, 30M, and 15M
* It checks whether the current close is above or below each EMA and labels it as:
* Bullish if close > EMA
* Bearish if close < EMA
* Each timeframe’s trend is displayed in a dynamic table in the top-right corner of the chart
* The background color of each cell changes according to trend condition for quick visual interpretation
* Real-time responsiveness: handles both historical and live bars to maintain accurate, flicker-free updates
WHY IT IS UNIQUE
* Combines multiple timeframe trend analysis into a single glance
* Clean and color-coded dashboard overlay for real-time trading decisions
* Avoids repainting using barstate logic for accurate trend updates
* Fully customizable table size and EMA length
* Works on any chart, including stocks, crypto, forex, indices
HOW USERS CAN BENEFIT FROM IT
* Multi-timeframe confirmation: Easily confirm alignment across timeframes before entering a trade
* Avoid false signals by ensuring higher timeframe trends agree with lower timeframe setups
* Enhance strategy filters: Use as a trend filter in combination with your existing entry indicators
* Quick market analysis: No need to switch between charts or manually calculate EMAs
* Visual clarity: Trend conditions are easy to read and interpret in real-time
Open-source script
In true TradingView spirit, the creator of this script has made it open-source, so that traders can review and verify its functionality. Kudos to the author! While you can use it for free, remember that republishing the code is subject to our House Rules.
Shivam mandai
Disclaimer
The information and publications are not meant to be, and do not constitute, financial, investment, trading, or other types of advice or recommendations supplied or endorsed by TradingView. Read more in the Terms of Use.