OPEN-SOURCE SCRIPT
Updated Percentage SD
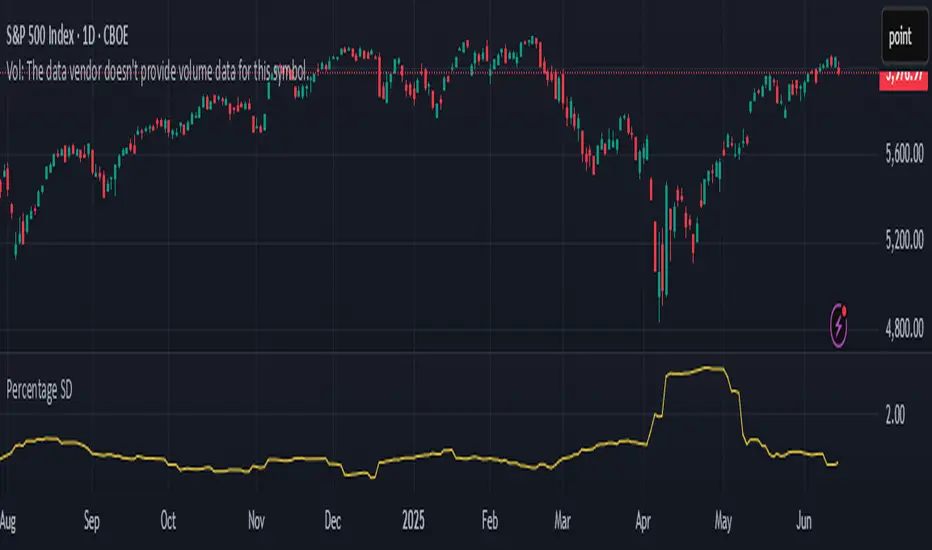
This TradingView indicator, called "Percentage SD," measures how much the price of an asset is fluctuating (its volatility) and shows this as a percentage.
You can choose which price to track (like the closing price) and the period over which to measure this volatility.
The indicator then draws a yellow line in a separate panel below your main chart. When this line is higher, it means the price is more volatile relative to its current level. A lower line suggests less volatility. This can help you see when price movements are becoming more or less active.
Release Notes
Improved calculation formula for better volatility tracking.Open-source script
In true TradingView spirit, the creator of this script has made it open-source, so that traders can review and verify its functionality. Kudos to the author! While you can use it for free, remember that republishing the code is subject to our House Rules.
Disclaimer
The information and publications are not meant to be, and do not constitute, financial, investment, trading, or other types of advice or recommendations supplied or endorsed by TradingView. Read more in the Terms of Use.
Open-source script
In true TradingView spirit, the creator of this script has made it open-source, so that traders can review and verify its functionality. Kudos to the author! While you can use it for free, remember that republishing the code is subject to our House Rules.
Disclaimer
The information and publications are not meant to be, and do not constitute, financial, investment, trading, or other types of advice or recommendations supplied or endorsed by TradingView. Read more in the Terms of Use.