OPEN-SOURCE SCRIPT
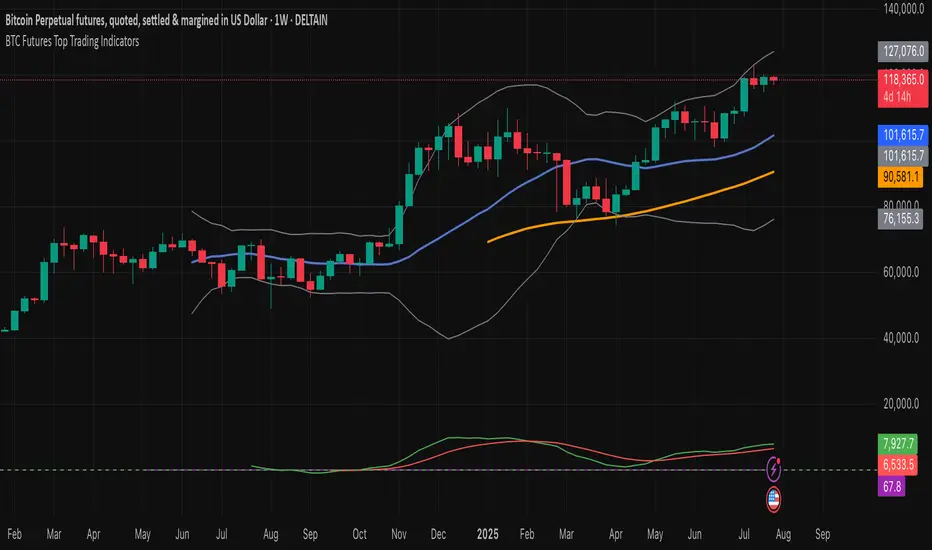
BTC Futures Top Trading Indicators
//version=5
indicator("BTC Futures Top Trading Indicators", overlay=true)
// Moving Averages
fast_ma = ta.sma(close, 20)
slow_ma = ta.sma(close, 50)
// RSI
rsi = ta.rsi(close, 14)
// MACD
[macdLine, signalLine, _] = ta.macd(close, 12, 26, 9)
// Bollinger Bands
bb_middle = ta.sma(close, 20)
bb_upper = bb_middle + 2 * ta.stdev(close, 20)
bb_lower = bb_middle - 2 * ta.stdev(close, 20)
// Plot Moving Averages
plot(fast_ma, color=color.blue, linewidth=2, title="20 SMA")
plot(slow_ma, color=color.orange, linewidth=2, title="50 SMA")
// Plot Bollinger Bands
plot(bb_upper, color=color.gray, title="Upper BB")
plot(bb_lower, color=color.gray, title="Lower BB")
plot(bb_middle, color=color.gray, title="Middle BB")
// Plot RSI in a separate window
rsi_plot = rsi
hline(70, "Overbought", color=color.red, linestyle=hline.style_dashed)
hline(30, "Oversold", color=color.green, linestyle=hline.style_dashed)
plot(rsi_plot, title="RSI", color=color.purple)
// Plot MACD
plot(macdLine, color=color.green, title="MACD Line")
plot(signalLine, color=color.red, title="Signal Line")
// Entry and Exit signals
buy_signal = ta.crossover(fast_ma, slow_ma) and rsi < 30 and macdLine > signalLine and close > bb_lower
sell_signal = ta.crossunder(fast_ma, slow_ma) and rsi > 70 and macdLine < signalLine and close < bb_upper
// Plot signals on chart
plotshape(buy_signal, title="Buy Signal", location=location.belowbar, color=color.green, style=shape.labelup, size=size.small)
plotshape(sell_signal, title="Sell Signal", location=location.abovebar, color=color.red, style=shape.labeldown, size=size.small)
Open-source script
In true TradingView spirit, the creator of this script has made it open-source, so that traders can review and verify its functionality. Kudos to the author! While you can use it for free, remember that republishing the code is subject to our House Rules.
Disclaimer
The information and publications are not meant to be, and do not constitute, financial, investment, trading, or other types of advice or recommendations supplied or endorsed by TradingView. Read more in the Terms of Use.