OPEN-SOURCE SCRIPT
Updated Banknifty Volume - IN
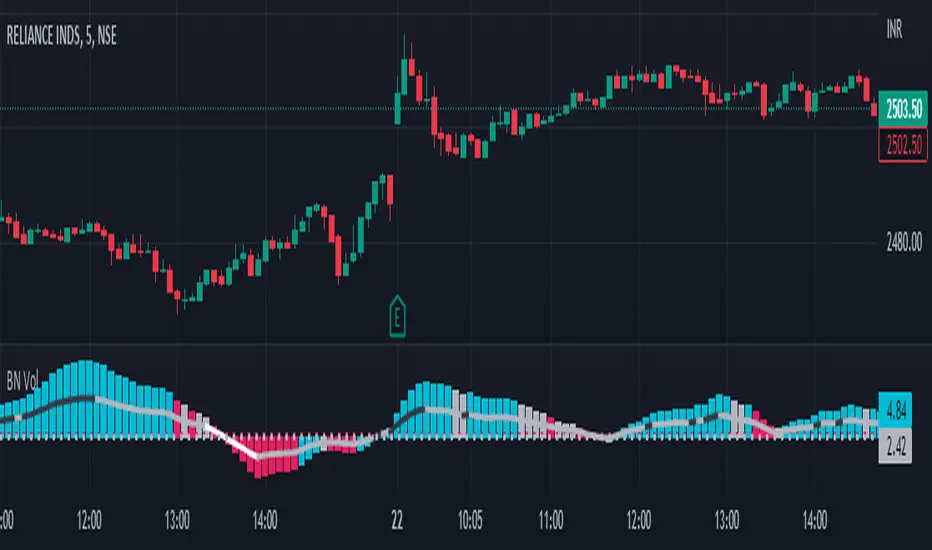
- This simple indicator computes the average Relative Strength Index of each Banknifty stock and displays the volume on the chart with color schemes while the average line indicates the average RSI of all Bank Stocks. This indicator works on Banknifty and its stocks.
- It works on all time frames
How You can use this?
You can use this indicator for Volume analysis if the average RSI line is above the 0 line, the stock is moving upside and vice versa for Downside .
Release Notes
- Minor changes : RSI Period added in setting and more confirmation using EMA
Release Notes
Set Timeframe as per your needRelease Notes
Improvement Release Notes
The Trend Reversal Cloud with Customized timeframe option was added to help forecast when reversals will happen.Release Notes
*** Minor bug fix ***Release Notes
Now you can set the weightage as per your requirements from setting panel Open-source script
In true TradingView spirit, the creator of this script has made it open-source, so that traders can review and verify its functionality. Kudos to the author! While you can use it for free, remember that republishing the code is subject to our House Rules.
Disclaimer
The information and publications are not meant to be, and do not constitute, financial, investment, trading, or other types of advice or recommendations supplied or endorsed by TradingView. Read more in the Terms of Use.
Open-source script
In true TradingView spirit, the creator of this script has made it open-source, so that traders can review and verify its functionality. Kudos to the author! While you can use it for free, remember that republishing the code is subject to our House Rules.
Disclaimer
The information and publications are not meant to be, and do not constitute, financial, investment, trading, or other types of advice or recommendations supplied or endorsed by TradingView. Read more in the Terms of Use.