OPEN-SOURCE SCRIPT
Moving Average Delta Indicator by KIVANC fr3762
Description:
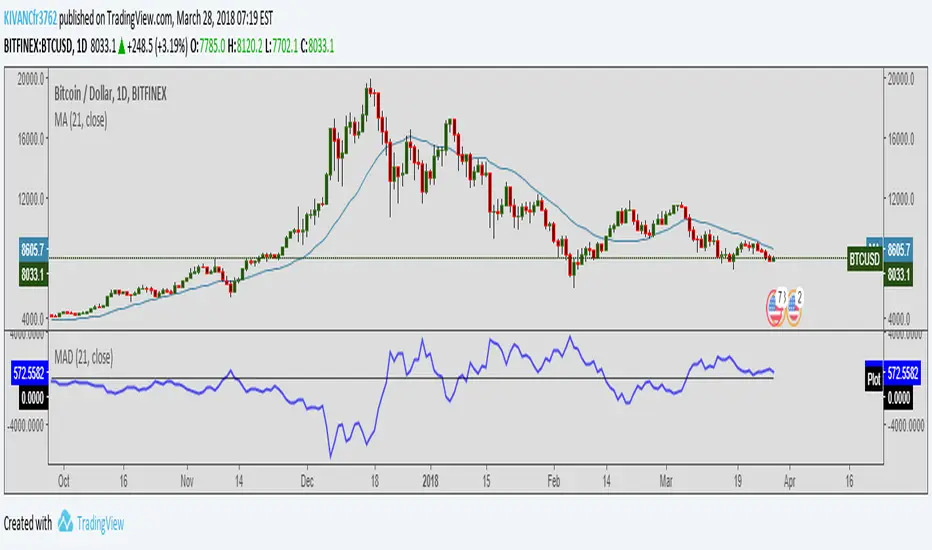
MAD stands for Moving Average Delta, it calculates the difference between moving average and price. The curve shows the difference in Pips.
By calculating the delta between two points we can see more small changes in the direction of the moving average curve which are normally hard to see. You can see the MAD curve as look through the microscope at a simple moving average curve. It may help predicting a trend change before it happens, the sample shows a beginning trend change from long to short.
Interpretation:
If the MAD curve is bigger than 0, the moving average is above the price
conversely;
If the MAD curve is smaller than 0, the moving average is below the price
Before a trend change, the moving average gets flatter, the MAD curve points to towards the zero
We can see what is the maximum rising/falling of the difference and predict an upcomming trend change
Usage:
Drop a simple moving average to a chart and set the period in a way that it best fits the movements. There is no "magic" settings for the moving average period, you may double click the MA line to set it to a different period.
Drop the MAD indicator to the cart and give it the same period as your simple moving average .
Open-source script
In true TradingView spirit, the creator of this script has made it open-source, so that traders can review and verify its functionality. Kudos to the author! While you can use it for free, remember that republishing the code is subject to our House Rules.
Telegram t.me/AlgoRhytm
YouTube (Turkish): youtube.com/c/kivancozbilgic
YouTube (English): youtube.com/c/AlgoWorld
YouTube (Turkish): youtube.com/c/kivancozbilgic
YouTube (English): youtube.com/c/AlgoWorld
Disclaimer
The information and publications are not meant to be, and do not constitute, financial, investment, trading, or other types of advice or recommendations supplied or endorsed by TradingView. Read more in the Terms of Use.