OPEN-SOURCE SCRIPT
Updated Compare TOTAL, TOTAL2, TOTAL3, and OTHERS
Compare TOTAL, TOTAL2, TOTAL3, and OTHERS
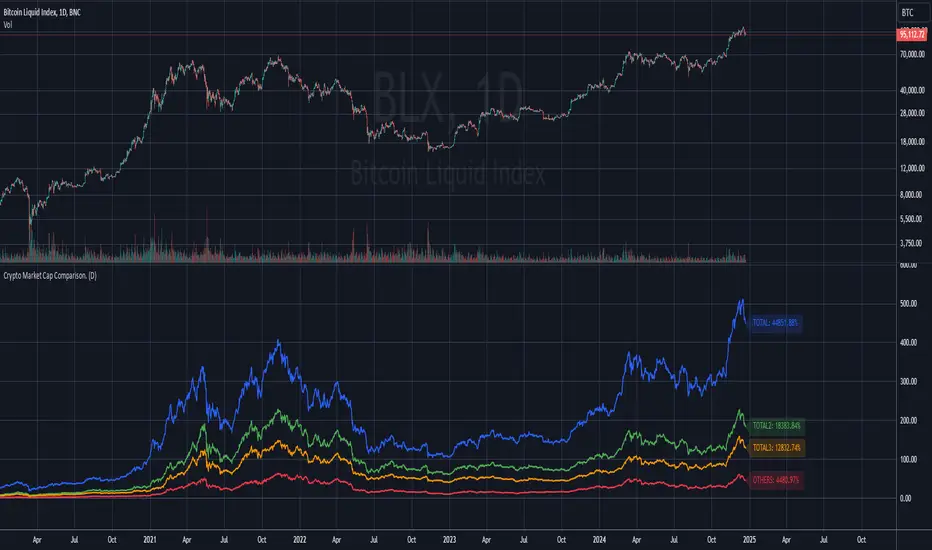
This indicator compares the performance of major cryptocurrency market cap indices: TOTAL, TOTAL2, TOTAL3, and OTHERS. It normalizes each index's performance relative to its starting value and visualizes their relative changes over time.
Features
- Normalized Performance: Tracks the percentage change of each index from its initial value.
- Customizable Timeframe: Allows users to select a base timeframe for the data (e.g., daily, weekly).
- Dynamic Labels: Displays the latest performance of each index as a label on the chart, aligned to the right of the corresponding line for easy comparison.
- Color-Coded Lines: Each index is assigned a distinct color for clear differentiation:
-- TOTAL (Blue): Represents the total cryptocurrency market cap.
-- TOTAL2 (Green): Excludes Bitcoin.
-- TOTAL3 (Orange): Excludes Bitcoin and Ethereum.
-- OTHERS (Red): Represents all cryptocurrencies excluding the top 10 by market cap.
- Baseline Reference: Includes a horizontal line at 0% for reference.
Use Cases:
- Market Trends: Identify which segments of the cryptocurrency market are outperforming or underperforming over time.
- Portfolio Insights: Assess the impact of Bitcoin and Ethereum dominance on the broader market.
- Market Analysis: Compare smaller-cap coins (OTHERS) with broader indices (TOTAL, TOTAL2, and TOTAL3).
This script is ideal for traders and analysts who want a quick, visual way to track how different segments of the cryptocurrency market perform relative to each other over time.
Note: The performance is normalized to highlight percentage changes, not absolute values.
Release Notes
screenshot updatedOpen-source script
In true TradingView spirit, the creator of this script has made it open-source, so that traders can review and verify its functionality. Kudos to the author! While you can use it for free, remember that republishing the code is subject to our House Rules.
Disclaimer
The information and publications are not meant to be, and do not constitute, financial, investment, trading, or other types of advice or recommendations supplied or endorsed by TradingView. Read more in the Terms of Use.
Open-source script
In true TradingView spirit, the creator of this script has made it open-source, so that traders can review and verify its functionality. Kudos to the author! While you can use it for free, remember that republishing the code is subject to our House Rules.
Disclaimer
The information and publications are not meant to be, and do not constitute, financial, investment, trading, or other types of advice or recommendations supplied or endorsed by TradingView. Read more in the Terms of Use.