OPEN-SOURCE SCRIPT
last week high and low
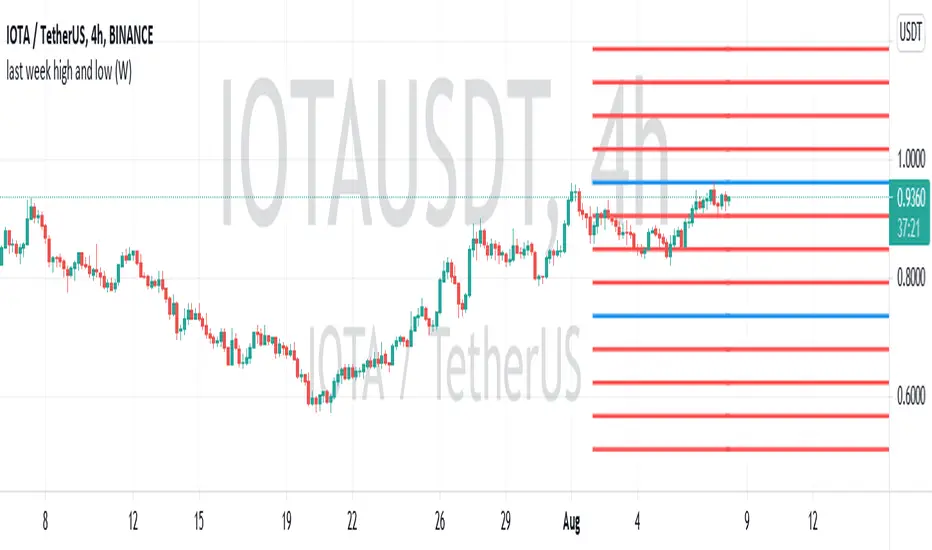
this script defines the highest and the lowest values of the last week. then illustrate and extend them into current week and future. they are define by blue lines.
in addition, the distance between high and low divided by 4. interior and exterior regions are split by these lines (red lines)
all lines can be considered as static support/resistance.
in addition, the distance between high and low divided by 4. interior and exterior regions are split by these lines (red lines)
all lines can be considered as static support/resistance.
Open-source script
In true TradingView spirit, the creator of this script has made it open-source, so that traders can review and verify its functionality. Kudos to the author! While you can use it for free, remember that republishing the code is subject to our House Rules.
Disclaimer
The information and publications are not meant to be, and do not constitute, financial, investment, trading, or other types of advice or recommendations supplied or endorsed by TradingView. Read more in the Terms of Use.