OPEN-SOURCE SCRIPT
Updated VWAP Spider
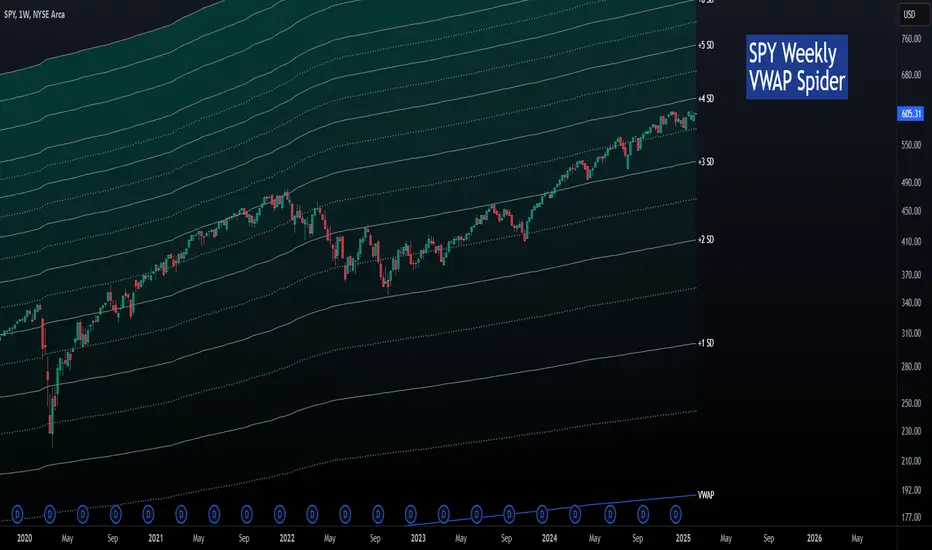
The VWAP Spider indicator enhances the conventional Volume Weighted Average Price (VWAP) analysis by anchoring it to the first candle and incorporating an extensive series of standard deviation (SD) lines, extending up to +8 SDs with additional half-step increments. This configuration provides a more suitable set of lines for identifying support and resistance, distinguishing it from existing VWAP and SD indicators. Its design, featuring color gradients for fills and distinct labels for each line, aims to improve the utility and user experience.
Optimal Timeframes:
It is recommended for use on weekly or monthly resolutions to ensure all price and volume history is included.
Distinctive Features:
Practical Use of the VWAP Spider:
This indicator is freely available and open-source on TradingView for all. It is designed to help traders enhance their market analysis and strategic decision-making.
Optimal Timeframes:
It is recommended for use on weekly or monthly resolutions to ensure all price and volume history is included.
Distinctive Features:
- The indicator includes a more extensive array of SD lines than typically found in VWAP indicators, enhancing the depth of market analysis.
- The visual presentation is optimized with color gradients and clear labeling, facilitating ease of use and integration into trading strategies.
Practical Use of the VWAP Spider:
- SD Lines as Support and Resistance: Observe the interactions between the price and the SD lines closely. These can serve as dynamic support and resistance indicators, influencing trading decisions.
- Analyzing Historical Price Action: Investigate how the price has historically interacted with the SD lines. Identify which lines have frequently acted as support and resistance in the past, as they will often continue to be revisited.
- Strategic Application: Leverage insights from the interactions between price and SD lines to fine-tune entry and exit points. For example, a rebound from an SD line may suggest a strong entry point, while breaching an SD line could indicate a potential exit.
This indicator is freely available and open-source on TradingView for all. It is designed to help traders enhance their market analysis and strategic decision-making.
Release Notes
Applied fix so that the standard deviation lines start on the first candle instead of the second.Added the option for users to customize the VWAP line color.
Release Notes
Minor visual enhancements & chart image update.Release Notes
Added labels to prior price action for easy identification.Release Notes
Removed the additional labels as they were causing issues.Enabled all resolutions instead of just daily and above.
Release Notes
- Updated to Pinescript v6
- Volume-weighted the standard deviation lines
- Increased the bullish standard deviations lines to 10 to work for stocks like AAPL and NVDA
Open-source script
In true TradingView spirit, the creator of this script has made it open-source, so that traders can review and verify its functionality. Kudos to the author! While you can use it for free, remember that republishing the code is subject to our House Rules.
Disclaimer
The information and publications are not meant to be, and do not constitute, financial, investment, trading, or other types of advice or recommendations supplied or endorsed by TradingView. Read more in the Terms of Use.