OPEN-SOURCE SCRIPT
Ashpi CVD + MACD Alert
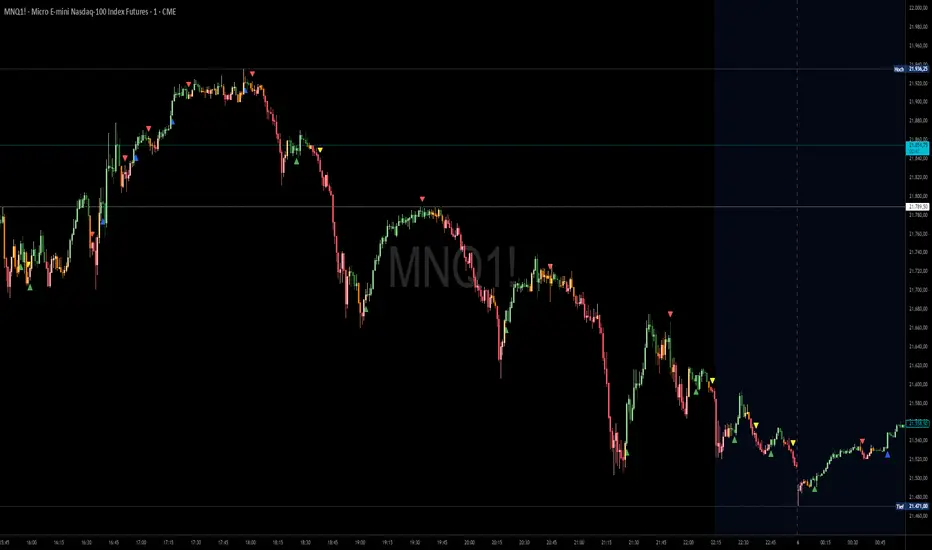
MACD Crossing + CVD Support
Red arrows signal short entries above the MACD zero line.
Green arrows signal long entries below the zero line.
Blue arrows indicate a re-entry into an existing long trend (crossing above the zero line), typically on pull-backs.
Yellow arrows indicate a re-entry into an existing short trend (crossing below the zero line).
Time-Frame Setup
- Entry on the 15-second chart
- Confirmation on the 30-second chart
- Trade management on the 1-minute chart (or higher)
Always follow the primary trend: RED = Short, GREEN = Long.
Sequence
1. RED signal appears → enter short
2. During the trade, if a GREEN arrow appears on the pull-back → exit trade, or add to position on a YELLOW arrow if the trend continues
The same applies to long trades and BLUE arrows.
Using EMAs (20, 50, 200) can help you spot structural breaks more clearly.
Signal Strength (Delta Distance to Zero Line)
The strength of each signal is enhanced by displaying the distance (delta) to the zero line in the chart:
- Green numbers mean the delta is already above its 10-period moving average (MA10).
- Red numbers mean the delta is below its MA10.
Identifying Sideways Markets
Use a standard MACD as an additional filter to spot ranging phases.
If YELLOW and BLUE arrows occur frequently in succession, it indicates the two MACD lines are moving very close together—trading such conditions should generally be avoided.
Open-source script
In true TradingView spirit, the creator of this script has made it open-source, so that traders can review and verify its functionality. Kudos to the author! While you can use it for free, remember that republishing the code is subject to our House Rules.
Disclaimer
The information and publications are not meant to be, and do not constitute, financial, investment, trading, or other types of advice or recommendations supplied or endorsed by TradingView. Read more in the Terms of Use.