OPEN-SOURCE SCRIPT
Updated ChangeTrend [kingthies_]
% X Change Over Y Amount of Time
AKA "ChangeTrend"
Published by user Eric Thies [kingthies_] on 9/3/2020
Description
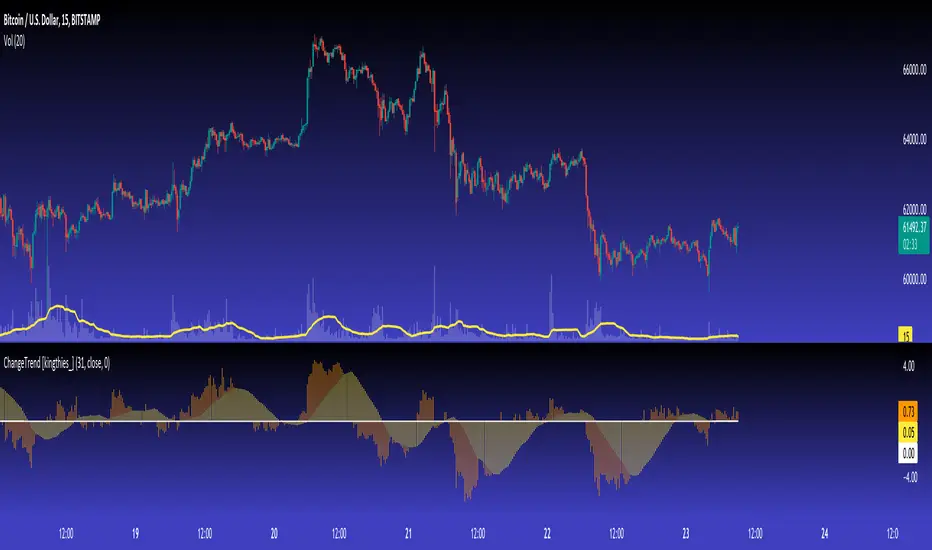
Relatively simple script that is measuring the performance of the input over the previous y # bars.
The EMA appears to make troughs and peaks easy to see coming / look at as they happen.
Interpretation:
Cheers,
AKA "ChangeTrend"
Published by user Eric Thies [kingthies_] on 9/3/2020
Description
Relatively simple script that is measuring the performance of the input over the previous y # bars.
The EMA appears to make troughs and peaks easy to see coming / look at as they happen.
Interpretation:
- Orange Histogram Represents the immediate % Change
- Yellow Histogram represents the overall trend of such as an SMA of the same Y # of bars.
Cheers,
Release Notes
Upgraded to pine v5Open-source script
In true TradingView spirit, the creator of this script has made it open-source, so that traders can review and verify its functionality. Kudos to the author! While you can use it for free, remember that republishing the code is subject to our House Rules.
Eric Thies
Disclaimer
The information and publications are not meant to be, and do not constitute, financial, investment, trading, or other types of advice or recommendations supplied or endorsed by TradingView. Read more in the Terms of Use.
Open-source script
In true TradingView spirit, the creator of this script has made it open-source, so that traders can review and verify its functionality. Kudos to the author! While you can use it for free, remember that republishing the code is subject to our House Rules.
Eric Thies
Disclaimer
The information and publications are not meant to be, and do not constitute, financial, investment, trading, or other types of advice or recommendations supplied or endorsed by TradingView. Read more in the Terms of Use.