OPEN-SOURCE SCRIPT
DRS - Daily Range System
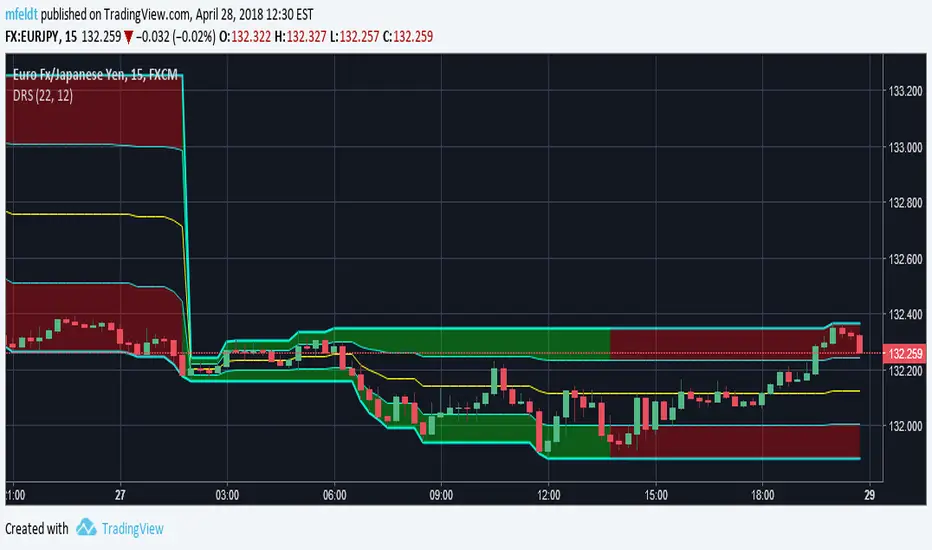
An indicator that visualizes the evolution of a daily candle, inspired by a thread on forexfactory: forexfactory.com/showthread.php?t=743125
Applied on a timeframe lower than D (actually lower than H4), it visualizes the evolution of the day's high and low, as well as mid and 25% and 75% lines.
The sole input parameters are the hour at which a day is supposed to start, and the extent of the "trade allowed" region as explained in the FF -1.44% thread.
Open-source script
In true TradingView spirit, the creator of this script has made it open-source, so that traders can review and verify its functionality. Kudos to the author! While you can use it for free, remember that republishing the code is subject to our House Rules.
Disclaimer
The information and publications are not meant to be, and do not constitute, financial, investment, trading, or other types of advice or recommendations supplied or endorsed by TradingView. Read more in the Terms of Use.