OPEN-SOURCE SCRIPT
ADR Pivot Levels
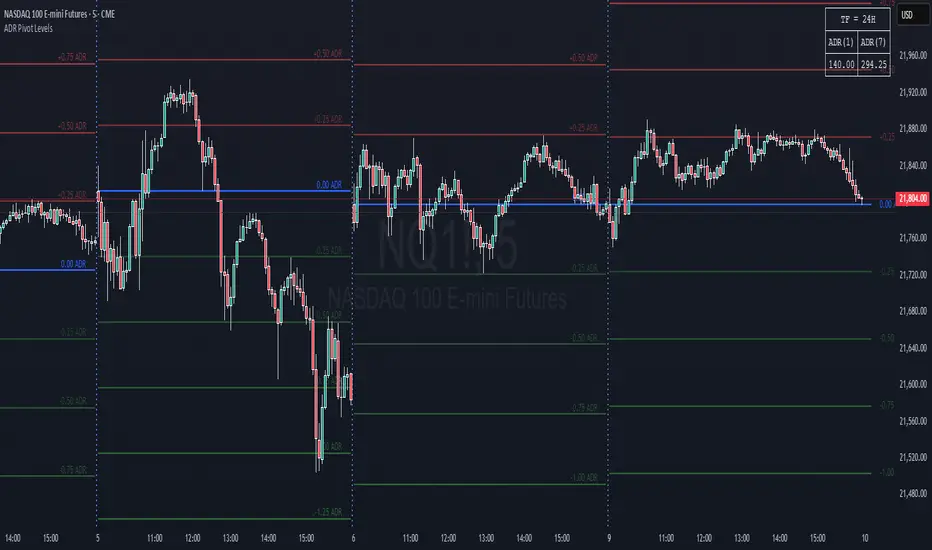
The ADR (Average Daily Range) indicator shows the average range of price movement over a trading day. The ADR is used to estimate volatility and to determine target levels. It helps to set Take-Profit and Stop-Loss orders. It is suitable for intraday trading on lower time frames.
The “ADR Pivot Levels” produces a sequence of horizontal line levels above and below the Center Line (reference level). They are sized based on the instrument's volatility, representing the average historical price movement on a selected higher timeframe using the average daily range (ADR) indicator.
The “ADR Pivot Levels” produces a sequence of horizontal line levels above and below the Center Line (reference level). They are sized based on the instrument's volatility, representing the average historical price movement on a selected higher timeframe using the average daily range (ADR) indicator.
Open-source script
In true TradingView spirit, the creator of this script has made it open-source, so that traders can review and verify its functionality. Kudos to the author! While you can use it for free, remember that republishing the code is subject to our House Rules.
Disclaimer
The information and publications are not meant to be, and do not constitute, financial, investment, trading, or other types of advice or recommendations supplied or endorsed by TradingView. Read more in the Terms of Use.