OPEN-SOURCE SCRIPT
UTS Chronos Levels
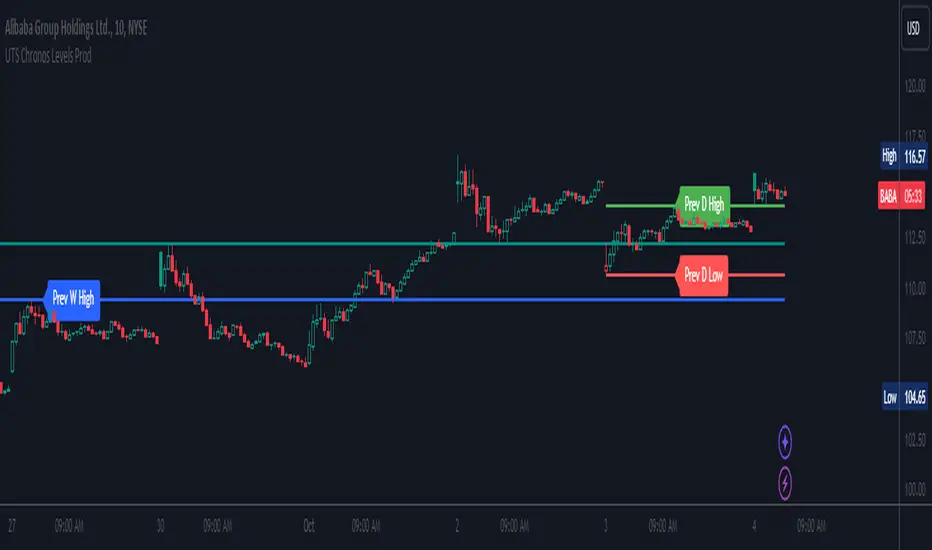
This indicator, called "UTS Chronos Levels ", is a Pine Script (version 5) overlay for Trading View charts.
Purpose:
The indicator displays key price levels from previous time periods (day, week, and month) on the chart. These levels can be used to identify potential support and resistance areas.
Levels Displayed:
Previous Day's High and Low
Previous Week's High and Low
Previous Month's High and Low
Visual Representation:
Each level is represented by a horizontal line extending from the start of the respective period to the current bar.
Lines are color-coded for easy identification:
• Previous Day: Green (High) and Red (Low)
• Previous Week: Blue (High) and Purple (Low)
• Previous Month: Teal (High) and Maroon (Low)
Labels:
Each line is accompanied by a label indicating the level it represents (e.g., "Prev D High", "Prev W Low", etc.).
Dynamic Updates:
The indicator detects new days, weeks, and months using the ta.change() function.
Lines and labels are updated at the start of each new period.
Efficiency:
The script uses persistent variables to store start points of periods and line objects.
Lines are redrawn on each last bar to prevent overcrowding and ensure up-to-date information.
Potential Use Cases:
Identifying potential support and resistance levels
Analyzing price action around previous period highs and lows
Developing trading strategies based on breakouts or rejections from these levels
This indicator can be particularly useful for traders who incorporate multi-timeframe analysis in their trading decisions, providing a quick visual reference for key levels from different time periods on a single chart.
Open-source script
In true TradingView spirit, the creator of this script has made it open-source, so that traders can review and verify its functionality. Kudos to the author! While you can use it for free, remember that republishing the code is subject to our House Rules.
Disclaimer
The information and publications are not meant to be, and do not constitute, financial, investment, trading, or other types of advice or recommendations supplied or endorsed by TradingView. Read more in the Terms of Use.