OPEN-SOURCE SCRIPT
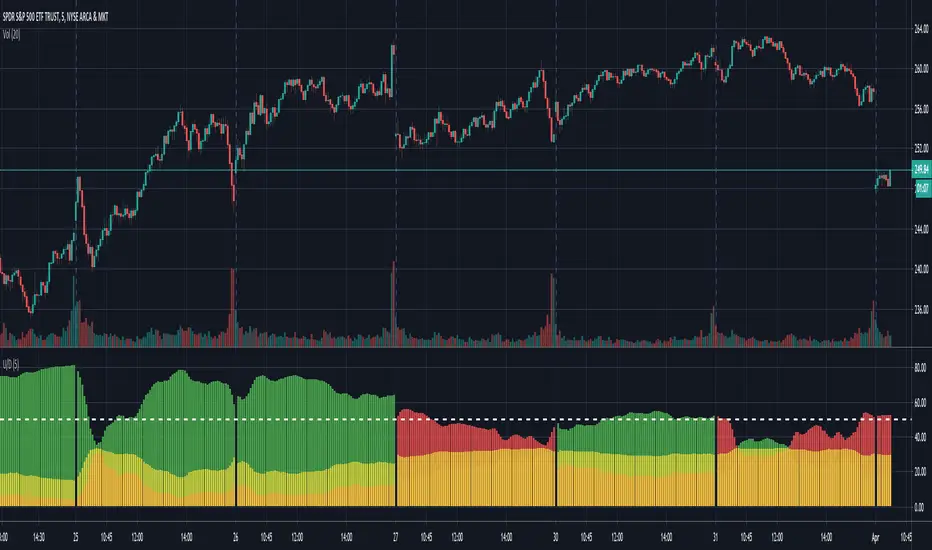
UVOL DVOL Strength and Stagnant Histogram
I liked the style of one of Noldo's scripts pertaining to Put/Call ratio so I adapted my existing UVol / DVol ratio script using his code from 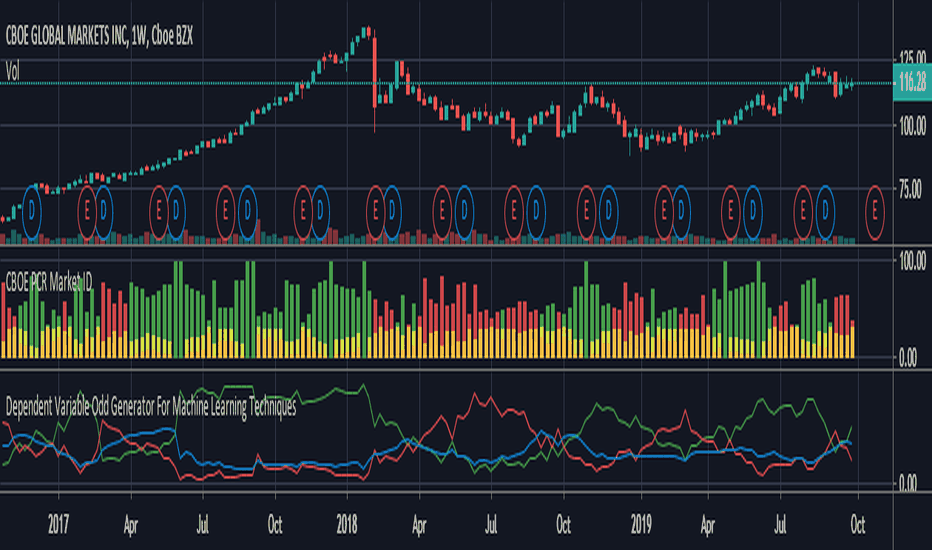
I am also reducing the number of securities referenced to only Nasdaq which speeds up displaying
The yellow bars are meant to represent stagnant volume, with green / red representing strong up or down volume.
Note the indicator will display the same no matter which individual stock you are watching since it uses UVol and DVol from the whole Nasdaq exchange NOT the stock or security you are currently viewing.
Open-source script
In true TradingView spirit, the creator of this script has made it open-source, so that traders can review and verify its functionality. Kudos to the author! While you can use it for free, remember that republishing the code is subject to our House Rules.
Disclaimer
The information and publications are not meant to be, and do not constitute, financial, investment, trading, or other types of advice or recommendations supplied or endorsed by TradingView. Read more in the Terms of Use.