OPEN-SOURCE SCRIPT
Unified Sentiment Candles Overlay (SMA)
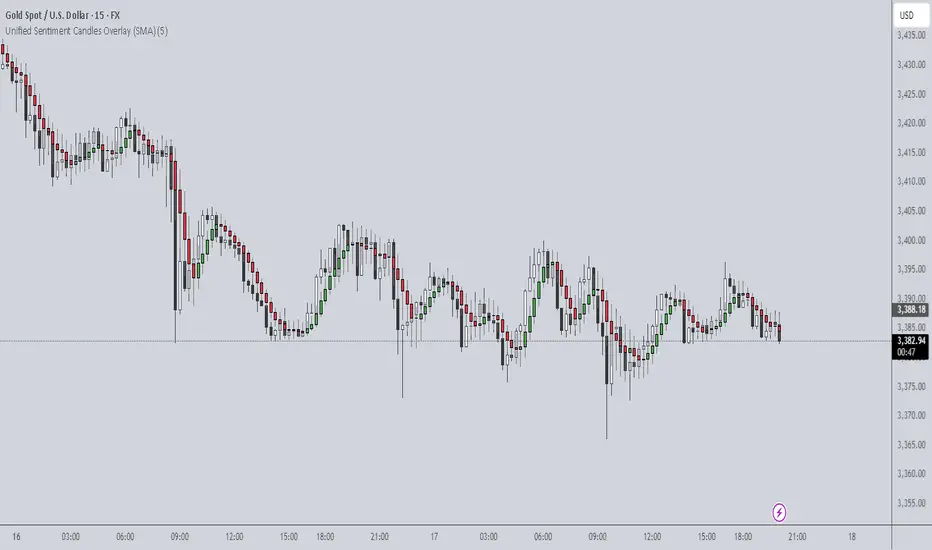
Unified Sentiment Candles (SMA) Indicator
The Unified Sentiment Candles (SMA) is a custom overlay indicator designed to provide a smoothed visualization of market sentiment by plotting synthetic candles based on the Simple Moving Average (SMA) of open, high, low, and close prices. It helps traders identify trend direction and potential reversals more clearly.
How to Use:
-Observe Candle Colors: Green candles indicate bullish sentiment (close ≥ open), while red candles suggest bearish sentiment (close < open).
-Trend Identification: Consistent green candles point to an uptrend, whereas consistent red candles may signal a downtrend.
-Support & Resistance Zones: The SMA-based candles smooth out short-term volatility, assisting in spotting key support and resistance levels.
-Entry & Exit Signals: Look for color changes or candle pattern formations within the synthetic candles to time entries and exits more effectively.
Settings:
SMA Length: Adjust this parameter to control the smoothing period. A shorter length makes the indicator more responsive, while a longer length smooths out more noise.
This indicator is best used in conjunction with other technical analysis tools to confirm signals and improve trading accuracy.
This script is open-source and licensed under the Mozilla Public License 2.0. Use and modify it at your own discretion.
Open-source script
In true TradingView spirit, the creator of this script has made it open-source, so that traders can review and verify its functionality. Kudos to the author! While you can use it for free, remember that republishing the code is subject to our House Rules.
Disclaimer
The information and publications are not meant to be, and do not constitute, financial, investment, trading, or other types of advice or recommendations supplied or endorsed by TradingView. Read more in the Terms of Use.