OPEN-SOURCE SCRIPT
Awesome Oscillator Twin Peaks Strategy
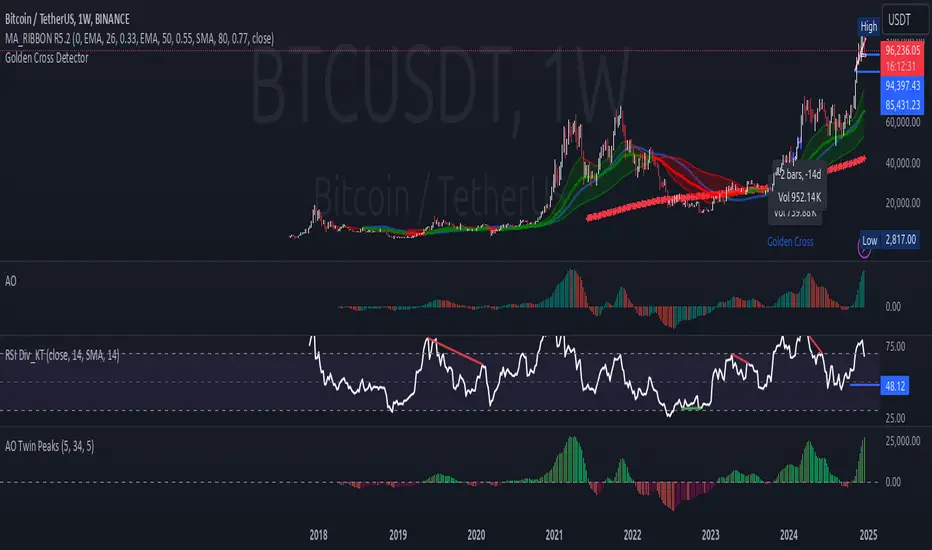
1. The indicator identifies both bullish and bearish twin peaks:
- Bullish: Two consecutive valleys below zero, where the second valley is higher than the first
- Bearish: Two consecutive peaks above zero, where the second peak is lower than the first
2. Visual elements:
- AO histogram with color-coding for increasing/decreasing values
- Triangle markers for confirmed twin peak signals
- Zero line for reference
- Customizable colors through inputs
3. Built-in safeguards:
- Minimum separation between peaks to avoid false signals
- Maximum time window for pattern completion
- Clear signal reset conditions
4. Alert conditions for both bullish and bearish signals
To use this indicator:
1. Add it to your TradingView chart
2. Customize the input parameters if needed
3. Look for triangle markers that indicate confirmed twin peak patterns
4. Optional: Set up alerts based on the signal conditions
Open-source script
In true TradingView spirit, the creator of this script has made it open-source, so that traders can review and verify its functionality. Kudos to the author! While you can use it for free, remember that republishing the code is subject to our House Rules.
Disclaimer
The information and publications are not meant to be, and do not constitute, financial, investment, trading, or other types of advice or recommendations supplied or endorsed by TradingView. Read more in the Terms of Use.