OPEN-SOURCE SCRIPT
Chop Zones
This indicator plots two "zones" in the form of shaded boxes, one between PMH and PML and one between PDH and PDL, the area that is shaded more has the highest probability of price action to be "choppy", the lesser shaded area has less probability for "choppy" action whilst outside the shaded areas there is high probability of a trend.
This indicator can be used to determine one of the three types of day:
Chop day
Bullish trend day
Bearish trend day
Chop day example today on SPY
SPY

Bullish trend day example on DLTR
DLTR

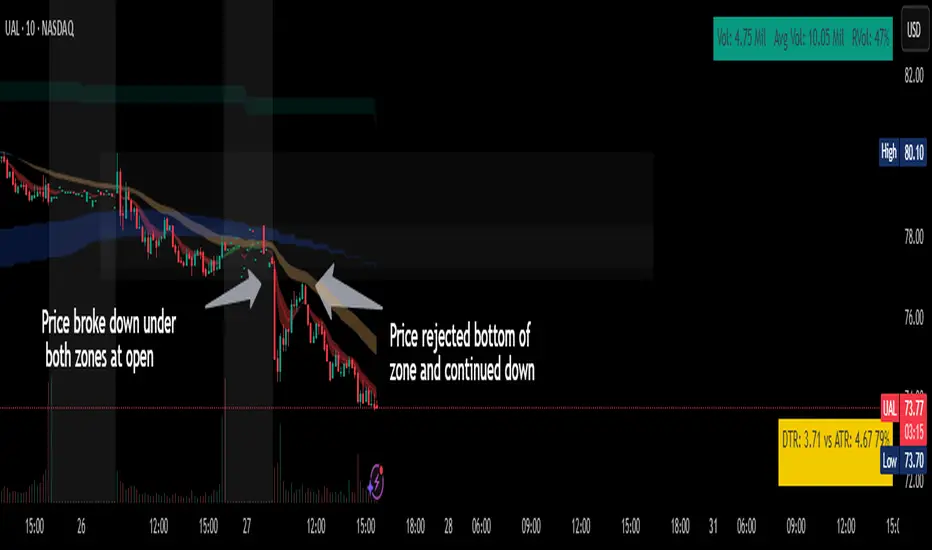
Bearish trend day example on UAL
UAL

This indicator can be used to determine one of the three types of day:
Chop day
Bullish trend day
Bearish trend day
Chop day example today on
Bullish trend day example on
Bearish trend day example on
Open-source script
In true TradingView spirit, the creator of this script has made it open-source, so that traders can review and verify its functionality. Kudos to the author! While you can use it for free, remember that republishing the code is subject to our House Rules.
Disclaimer
The information and publications are not meant to be, and do not constitute, financial, investment, trading, or other types of advice or recommendations supplied or endorsed by TradingView. Read more in the Terms of Use.