OPEN-SOURCE SCRIPT
RV Indicator
This Pine Script defines a custom Relative Volatility (RV) Indicator, which measures the ratio of directional price movement to volatility over a specified number of bars. Below is a full explanation of what this script does.
Title:
RV Indicator — Relative Volatility Oscillator
Purpose:
This indicator measures how aggressively price is moving compared to recent volatility, and smooths the result with a signal line. It can be used to gauge momentum shifts and trend strength.
How It Works – Step by Step
1. Measuring Price Momentum (v1)
It calculates the difference between the close and open prices of the last 4 candles.
A weighted average is applied:
The current candle and the one 3 bars ago get weight 1.
The two middle candles (1 and 2 bars ago) get weight 2.
This creates a smoothed momentum measure:
If close > open (bullish), v1 is positive.
If close < open (bearish), v1 is negative.
2. Measuring Volatility (v2)
Similarly, it calculates the high-low range for the last 4 candles.
The same weighting (1, 2, 2, 1) is applied.
This gives a smoothed volatility measure.
3. Combining Momentum and Volatility (RV Ratio)
For the past ti bars (default: 10), it sums up:
All v1 values (momentum sum)
All v2 values (volatility sum)
Then it divides them:
𝑅𝑉= sum of price momentum % sum of volatility
This produces the RV value:
RV > 0: Momentum is bullish (price is generally moving up relative to its volatility).
RV < 0: Momentum is bearish (price is moving down relative to its volatility).
4. Smoothed Signal Line (rvsig)
A smoothed version of the RV is created using a weighted average of the latest 4 RV values.
This acts like a signal line, similar to how MACD uses a signal line.
Crossovers between RV and this signal line can be used to detect shifts in momentum.
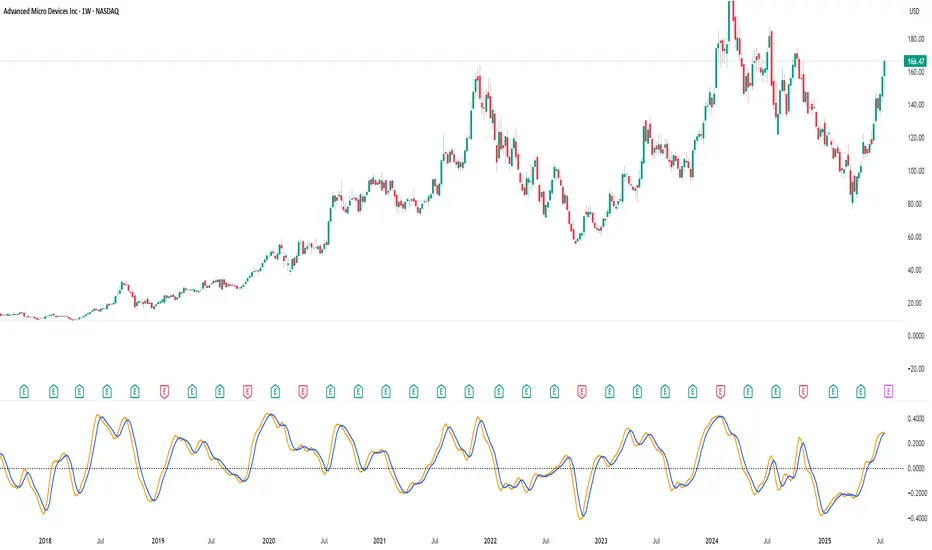
5. Visual Output
Orange Line (RV): Shows the raw momentum/volatility ratio.
Blue Line (Signal): A smoother line that follows RV more slowly.
Zero Line: Divides bullish vs. bearish momentum.
How to Use It in Trading
1. Look for Crossovers:
If RV crosses above its signal line → Possible buy signal (momentum turning bullish).
If RV crosses below its signal line → Possible sell signal (momentum turning bearish).
2. Check the Zero Line:
If both RV and Signal are above zero, momentum is bullish.
If both are below zero, momentum is bearish.
3. Filter False Signals:
Combine RV with a trend filter (like a 50 or 200 EMA) to avoid trading against the main trend.
Disclaimer: This script is for informational and educational purposes only. It does not constitute financial advice or a recommendation to buy or sell any asset. All trading decisions are solely your responsibility. Use at your own risk.
Title:
RV Indicator — Relative Volatility Oscillator
Purpose:
This indicator measures how aggressively price is moving compared to recent volatility, and smooths the result with a signal line. It can be used to gauge momentum shifts and trend strength.
How It Works – Step by Step
1. Measuring Price Momentum (v1)
It calculates the difference between the close and open prices of the last 4 candles.
A weighted average is applied:
The current candle and the one 3 bars ago get weight 1.
The two middle candles (1 and 2 bars ago) get weight 2.
This creates a smoothed momentum measure:
If close > open (bullish), v1 is positive.
If close < open (bearish), v1 is negative.
2. Measuring Volatility (v2)
Similarly, it calculates the high-low range for the last 4 candles.
The same weighting (1, 2, 2, 1) is applied.
This gives a smoothed volatility measure.
3. Combining Momentum and Volatility (RV Ratio)
For the past ti bars (default: 10), it sums up:
All v1 values (momentum sum)
All v2 values (volatility sum)
Then it divides them:
𝑅𝑉= sum of price momentum % sum of volatility
This produces the RV value:
RV > 0: Momentum is bullish (price is generally moving up relative to its volatility).
RV < 0: Momentum is bearish (price is moving down relative to its volatility).
4. Smoothed Signal Line (rvsig)
A smoothed version of the RV is created using a weighted average of the latest 4 RV values.
This acts like a signal line, similar to how MACD uses a signal line.
Crossovers between RV and this signal line can be used to detect shifts in momentum.
5. Visual Output
Orange Line (RV): Shows the raw momentum/volatility ratio.
Blue Line (Signal): A smoother line that follows RV more slowly.
Zero Line: Divides bullish vs. bearish momentum.
How to Use It in Trading
1. Look for Crossovers:
If RV crosses above its signal line → Possible buy signal (momentum turning bullish).
If RV crosses below its signal line → Possible sell signal (momentum turning bearish).
2. Check the Zero Line:
If both RV and Signal are above zero, momentum is bullish.
If both are below zero, momentum is bearish.
3. Filter False Signals:
Combine RV with a trend filter (like a 50 or 200 EMA) to avoid trading against the main trend.
Disclaimer: This script is for informational and educational purposes only. It does not constitute financial advice or a recommendation to buy or sell any asset. All trading decisions are solely your responsibility. Use at your own risk.
Open-source script
In true TradingView spirit, the creator of this script has made it open-source, so that traders can review and verify its functionality. Kudos to the author! While you can use it for free, remember that republishing the code is subject to our House Rules.
Disclaimer
The information and publications are not meant to be, and do not constitute, financial, investment, trading, or other types of advice or recommendations supplied or endorsed by TradingView. Read more in the Terms of Use.