OPEN-SOURCE SCRIPT
Updated WaveTrend Matrix (1m-1w) – Custom Thresholds
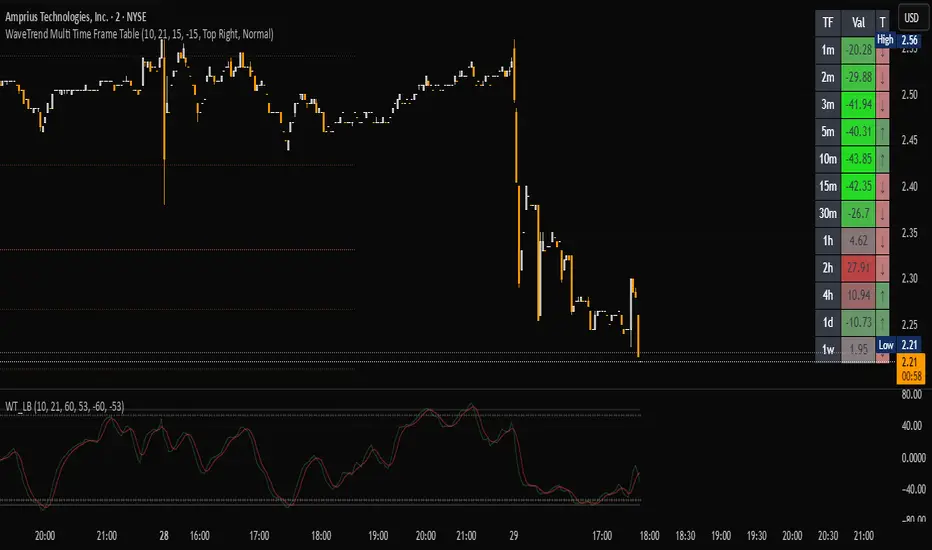
A visual control panel for momentum exhaustion across ten key time-frames.
—
🧬 DNA
This is a fork of LazyBear’s original WaveTrend Oscillator.
The oscillator logic is 100 % intact; I simply stream the values into a compact table so that day- and swing-traders can see the “bigger picture” at a glance.
📈 What does it do?
🛠 Parameters
🚀 How to use it
1. Apply the indicator to your chart – no extra setup required.
2. Read the matrix top-down before every entry:
• Multiple deep-green rows → market broadly oversold → watch for longs.
• Multiple deep-red rows → market broadly overbought → watch for shorts or stay flat.
3. Combine with your trend filter (EMA-stack, VWAP, structure) to avoid counter-trend trades.
—
🧬 DNA
This is a fork of LazyBear’s original WaveTrend Oscillator.
The oscillator logic is 100 % intact; I simply stream the values into a compact table so that day- and swing-traders can see the “bigger picture” at a glance.
📈 What does it do?
- Calculates WaveTrend on ten granularities: 1m, 3m, 5m, 15m, 30m, 1h, 2h, 4h, 1d, 1w.
- Displays the current oscillator print in a color-coded matrix.
• [color=red]Red[/color] = overbought (≥ high threshold)
• [color=green]Green[/color] = oversold (≤ low threshold)
• [color=gray]Gray[/color] = neutral / in-range - All thresholds are user-adjustable.
- Built on Pine v5, zero repainting, works on any symbol.
🛠 Parameters
- Channel Length – WT “n1” (default 10)
- Average Length – WT “n2” (default 21)
- Red from – overbought cut-off (default +60)
- Green under – oversold cut-off (default –60)
🚀 How to use it
1. Apply the indicator to your chart – no extra setup required.
2. Read the matrix top-down before every entry:
• Multiple deep-green rows → market broadly oversold → watch for longs.
• Multiple deep-red rows → market broadly overbought → watch for shorts or stay flat.
3. Combine with your trend filter (EMA-stack, VWAP, structure) to avoid counter-trend trades.
Release Notes
A visual control panel for momentum exhaustion across ten key time-frames.—
🧬 DNA
This is a fork of LazyBear’s original WaveTrend Oscillator.
The oscillator logic is 100 % intact; I simply stream the values into a compact table so that day- and swing-traders can see the “bigger picture” at a glance.
📈 What does it do?
- Calculates WaveTrend on ten granularities: 1m, 3m, 5m, 15m, 30m, 1h, 2h, 4h, 1d, 1w.
- Displays the current oscillator print in a color-coded matrix.
• [color=red]Red[/color] = overbought (≥ high threshold)
• [color=green]Green[/color] = oversold (≤ low threshold)
• [color=gray]Gray[/color] = neutral / in-range - All thresholds are user-adjustable.
- Built on Pine v5, zero repainting, works on any symbol.
🛠 Parameters
- Channel Length – WT “n1” (default 10)
- Average Length – WT “n2” (default 21)
- Red from – overbought cut-off (default +60)
- Green under – oversold cut-off (default –60)
🚀 How to use it
1. Apply the indicator to your chart – no extra setup required.
2. Read the matrix top-down before every entry:
• Multiple deep-green rows → market broadly oversold → watch for longs.
• Multiple deep-red rows → market broadly overbought → watch for shorts or stay flat.
3. Combine with your trend filter (EMA-stack, VWAP, structure) to avoid counter-trend trades.
Release Notes
A visual control panel for momentum exhaustion across ten key time-frames, now with dual-threshold colours and a movable dashboard.—
🧬 DNA
This is a fork of LazyBear’s original WaveTrend Oscillator.
The oscillator logic is 100 % intact; I simply stream the values into a compact table so that day- and swing-traders can see the “bigger picture” at a glance.
📈 What does it do?
- []Calculates WaveTrend on ten granularities: 1m, 3m, 5m, 15m, 30m, 1h, 2h, 4h, 1d, 1w.
[]Displays the current oscillator print in a colour-coded matrix.
• [color=red]Deep Red[/color] = extreme overbought (≥ +60)
• [color=#EC7474]Mild Red[/color] = custom early-warning overbought (≥ Custom High)
• [color=#30D430]Mild Green[/color] = custom early-warning oversold (≤ Custom Low)
• [color=#2B9700]Neon Green[/color] = extreme oversold (≤ –60)
• [color=gray]Gray[/color] = neutral / in-range
[]Optional hard-coded ±60 extremes can be switched on/off.
[]Table position is selectable (any corner or centre). - Built on Pine v5, zero repainting, works on any symbol.
🛠 Parameters
- []Channel Length – WT “n1” (default 10)
[]Average Length – WT “n2” (default 21)
[]Custom High – mild-red threshold for early overbought (default +15)
[]Custom Low – mild-green threshold for early oversold (default –15)
[]Always apply ±60 thresholds – forces deep-red / neon-green extremes (toggle)
[]Table Position – anchor the matrix: Top Left / Top Center / … / Bottom Right (default Top Right)
🚀 How to use it
Apply the indicator to your chart – no extra setup required.
Read the matrix top-down before every entry:
• Multiple neon-green rows → market broadly oversold → watch for longs.
• Multiple deep-red rows → market broadly overbought → watch for shorts or stay flat.
Combine with your trend filter (EMA-stack, VWAP, structure) to avoid counter-trend trades.
Release Notes
A visual control panel for momentum exhaustion across ten key time-frames, now with dual-threshold colours and a movable dashboard.—
🧬 DNA
This is a fork of LazyBear’s original WaveTrend Oscillator.
The oscillator logic is 100 % intact; I simply stream the values into a compact table so that day- and swing-traders can see the “bigger picture” at a glance.
📈 What does it do?
- []Calculates WaveTrend on ten granularities: 1m, 3m, 5m, 15m, 30m, 1h, 2h, 4h, 1d, 1w.
[]Displays the current oscillator print in a colour-coded matrix.
• [color=red]Deep Red[/color] = extreme overbought (≥ +60)
• [color=#EC7474]Mild Red[/color] = custom early-warning overbought (≥ Custom High)
• [color=#30D430]Mild Green[/color] = custom early-warning oversold (≤ Custom Low)
• [color=#2B9700]Neon Green[/color] = extreme oversold (≤ –60)
• [color=gray]Gray[/color] = neutral / in-range
[]Optional hard-coded ±60 extremes can be switched on/off.
[]Table position is selectable (any corner or centre). - Built on Pine v5, zero repainting, works on any symbol.
🛠 Parameters
- []Channel Length – WT “n1” (default 10)
[]Average Length – WT “n2” (default 21)
[]Apply own thresholds (no gradient) - Disables the default gradient color scheme and applies custom coloring based on these thresholds:
[]Custom High – red threshold for overbought (default +15)
[]Custom Low – green threshold for oversold (default –15)
[]Always apply ±60 thresholds – forces deep-red / neon-green extremes (toggle)
[]Table Position – anchor the matrix: Top Left / Top Center / … / Bottom Right (default Top Right)
🚀 How to use it
Apply the indicator to your chart – no extra setup required.
Read the matrix top-down before every entry:
• Multiple neon-green rows → market broadly oversold → watch for longs.
• Multiple deep-red rows → market broadly overbought → watch for shorts or stay flat.
Combine with your trend filter (EMA-stack, VWAP, structure) to avoid counter-trend trades.
Release Notes
A visual control panel for momentum exhaustion across ten key time-frames, now with dual-threshold colours and a movable dashboard.—
🧬 DNA
This is a fork of LazyBear’s original WaveTrend Oscillator.
The oscillator logic is 100 % intact; I simply stream the values into a compact table so that day- and swing-traders can see the “bigger picture” at a glance.
📈 What does it do?
- Calculates WaveTrend on ten granularities: 1m, 3m, 5m, 15m, 30m, 1h, 2h, 4h, 1d, 1w.
- Displays the current oscillator print in a colour-coded matrix.
- Optional hard-coded ±60 extremes can be switched on/off.
- Table position is selectable (any corner or centre).
🛠 Parameters
- Channel Length – WT “n1” (default 10)
- Average Length – WT “n2” (default 21)
- Apply own thresholds (no gradient) - Disables the default gradient color scheme and applies custom coloring based on these thresholds:
- Custom High – red threshold for overbought (default +15)
- Custom Low – green threshold for oversold (default –15)
- Always apply ±60 thresholds – forces deep-red / neon-green extremes (toggle)
- Table Position – anchor the matrix: Top Left / Top Center / … / Bottom Right (default Top Right)
🚀 How to use it
Apply the indicator to your chart – no extra setup required.
Read the matrix top-down before every entry:
• Multiple neon-green rows → market broadly oversold → watch for longs.
• Multiple deep-red rows → market broadly overbought → watch for shorts or stay flat.
Combine with your trend filter (EMA-stack, VWAP, structure) to avoid counter-trend trades.
Release Notes
A visual control panel for momentum exhaustion across ten key time-frames, now with dual-threshold colours and a movable dashboard.—
🧬 DNA
This is a fork of LazyBear’s original WaveTrend Oscillator.
The oscillator logic is 100 % intact; I simply stream the values into a compact table so that day- and swing-traders can see the “bigger picture” at a glance.
📈 What does it do?
- Calculates WaveTrend on ten granularities: 1m, 3m, 5m, 15m, 30m, 1h, 2h, 4h, 1d, 1w.
- Displays the current oscillator print in a colour-coded matrix.
- Optional hard-coded ±60 extremes can be switched on/off.
- Table position is selectable (any corner or centre).
- Built on Pine v5, zero repainting, works on any symbol.
🛠 Parameters
- Channel Length – WT “n1” (default 10)
- Average Length – WT “n2” (default 21)
- Apply own thresholds (no gradient) - Disables the default gradient color scheme and applies custom coloring based on these thresholds:
- Custom High – red threshold for overbought (default +15)
- Custom Low – green threshold for oversold (default –15)
- Always apply ±60 thresholds – forces deep-red / neon-green extremes (toggle)
- Table Position – anchor the matrix: Top Left / Top Center / … / Bottom Right (default Top Right)
🚀 How to use it
Apply the indicator to your chart – no extra setup required.
Read the matrix top-down before every entry:
• Multiple neon-green rows → market broadly oversold → watch for longs.
• Multiple deep-red rows → market broadly overbought → watch for shorts or stay flat.
Combine with your trend filter (EMA-stack, VWAP, structure) to avoid counter-trend trades.
Open-source script
In true TradingView spirit, the creator of this script has made it open-source, so that traders can review and verify its functionality. Kudos to the author! While you can use it for free, remember that republishing the code is subject to our House Rules.
Disclaimer
The information and publications are not meant to be, and do not constitute, financial, investment, trading, or other types of advice or recommendations supplied or endorsed by TradingView. Read more in the Terms of Use.