OPEN-SOURCE SCRIPT
Updated RSI buy/sell partitions
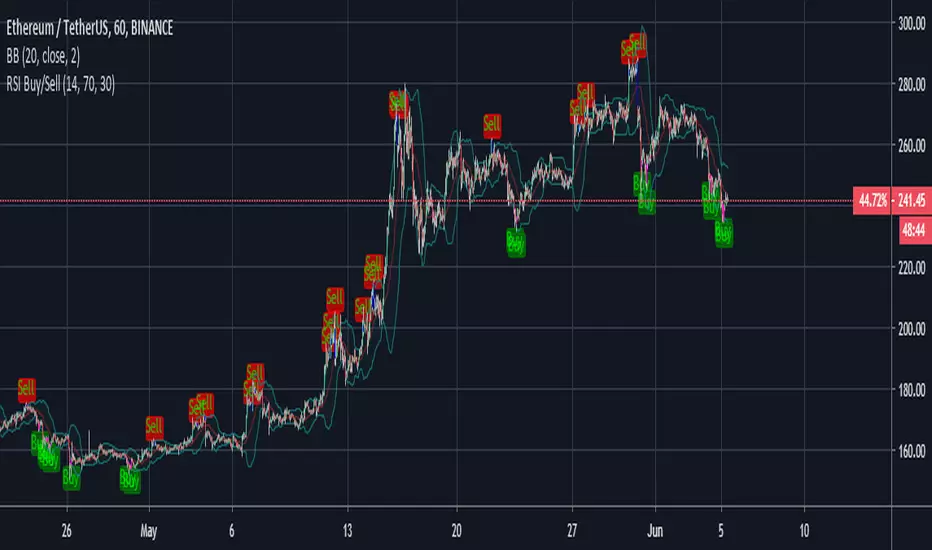
Look overbought and overbought to predict the time of the transaction.
RSI overbought:
- RSI = 21 to 30 (default configuration): The graph showing the letters 'Buy' and candles will have different colors.
- RSI < 21 (default configuration): The graph showing the letters 'Buy' displays bold and the candles will have high light background colors.

RSI oversold:
- RSI = 70 to 79 (default configuration): The chart that shows the word 'sell' and the candlestick will have different colors.
- RSI > 80 (default configuration): Display chart for 'Sell' displays bold and candles will have high light background colors.

RSI overbought:
- RSI = 21 to 30 (default configuration): The graph showing the letters 'Buy' and candles will have different colors.
- RSI < 21 (default configuration): The graph showing the letters 'Buy' displays bold and the candles will have high light background colors.
RSI oversold:
- RSI = 70 to 79 (default configuration): The chart that shows the word 'sell' and the candlestick will have different colors.
- RSI > 80 (default configuration): Display chart for 'Sell' displays bold and candles will have high light background colors.
Release Notes
Change text 'RSI Higher' to 'Advanced'Release Notes
Add comment textRelease Notes
Modify: Optimal RSI based trading indicator
Open-source script
In true TradingView spirit, the creator of this script has made it open-source, so that traders can review and verify its functionality. Kudos to the author! While you can use it for free, remember that republishing the code is subject to our House Rules.
Disclaimer
The information and publications are not meant to be, and do not constitute, financial, investment, trading, or other types of advice or recommendations supplied or endorsed by TradingView. Read more in the Terms of Use.