OPEN-SOURCE SCRIPT
PnL_EMA_TRACK12_PRO_3.3_full_adjusted
# Multi-Ticker Support
Manage up to 12 tickers simultaneously.
- For each symbol, input share quantities, entry prices, and two optional additional entry points (E2, E3) with their own shares and offset percentages.
- Dynamic handling of inputs using arrays for easier maintenance and scalability.
# Average Cost and PnL Calculation
- Computes weighted average entry costs across all position parts (E1 and optionally E2 and E3).
- Calculates real-time Profit & Loss (PnL) both in USD and percentage relative to the current price.
- Color-coded values: green for profit, red for loss — for quick visual feedback.
# Moving Averages as Benchmarks
- Uses daily EMAs (10, 21, 65) and 15-minute SMA 200 as reference levels.
- Calculates percentage deviations of these moving averages from the average entry price.
- Calculates dollar differences based on the total shares held.
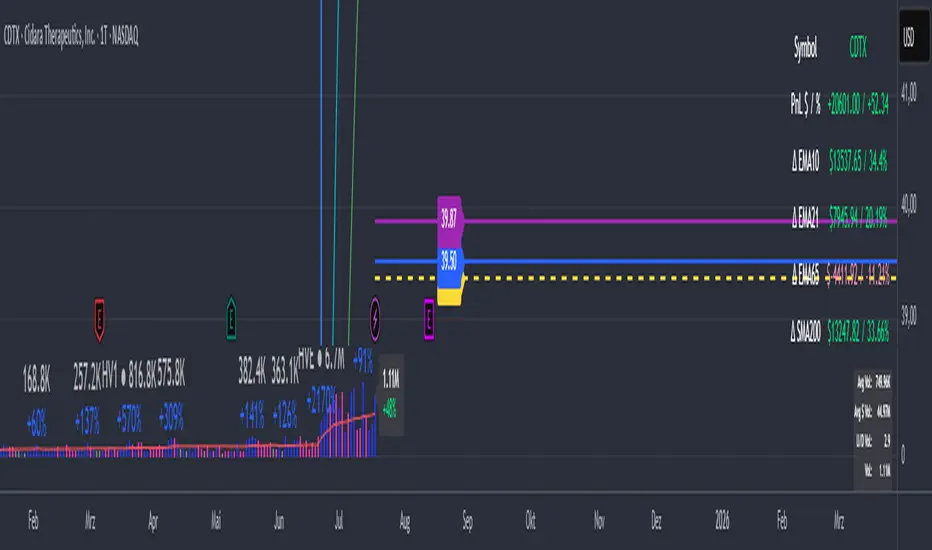
# Chart Visualization
- Draws a dashed yellow line for the average cost of each position.
- Optionally draws two additional lines and labels for E2 (blue) and E3 (purple) if activated.
- Lines extend to the right to emphasize current relevance.
- Labels can be positioned left or right, with customizable horizontal offset.
# Interactive Table in Chart
- Positions the info table in any chosen corner or center of the chart (top/right/left/middle, etc.).
- Displays symbol, PnL (dollar and percentage), and deviations to key EMAs and SMA.
- Colors PnL values according to profit or loss for instant clarity.
# User-Friendly Settings
- Flexible font size options for both the table and labels.
- Customizable colors for positive and negative values (default green/red).
- Choice of label position and X-axis offset to fit your chart style.
Manage up to 12 tickers simultaneously.
- For each symbol, input share quantities, entry prices, and two optional additional entry points (E2, E3) with their own shares and offset percentages.
- Dynamic handling of inputs using arrays for easier maintenance and scalability.
# Average Cost and PnL Calculation
- Computes weighted average entry costs across all position parts (E1 and optionally E2 and E3).
- Calculates real-time Profit & Loss (PnL) both in USD and percentage relative to the current price.
- Color-coded values: green for profit, red for loss — for quick visual feedback.
# Moving Averages as Benchmarks
- Uses daily EMAs (10, 21, 65) and 15-minute SMA 200 as reference levels.
- Calculates percentage deviations of these moving averages from the average entry price.
- Calculates dollar differences based on the total shares held.
# Chart Visualization
- Draws a dashed yellow line for the average cost of each position.
- Optionally draws two additional lines and labels for E2 (blue) and E3 (purple) if activated.
- Lines extend to the right to emphasize current relevance.
- Labels can be positioned left or right, with customizable horizontal offset.
# Interactive Table in Chart
- Positions the info table in any chosen corner or center of the chart (top/right/left/middle, etc.).
- Displays symbol, PnL (dollar and percentage), and deviations to key EMAs and SMA.
- Colors PnL values according to profit or loss for instant clarity.
# User-Friendly Settings
- Flexible font size options for both the table and labels.
- Customizable colors for positive and negative values (default green/red).
- Choice of label position and X-axis offset to fit your chart style.
Open-source script
In true TradingView spirit, the creator of this script has made it open-source, so that traders can review and verify its functionality. Kudos to the author! While you can use it for free, remember that republishing the code is subject to our House Rules.
Disclaimer
The information and publications are not meant to be, and do not constitute, financial, investment, trading, or other types of advice or recommendations supplied or endorsed by TradingView. Read more in the Terms of Use.