OPEN-SOURCE SCRIPT
Updated Slope Normalized (SN)
Introduction:
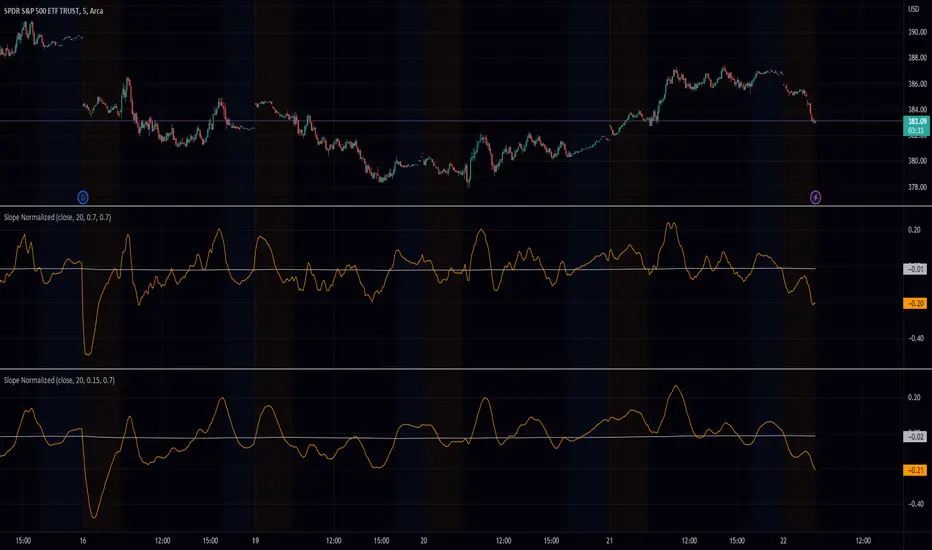
The Normalized Slope script is a technical indicator that aims to measure the strength and direction of a trend in a financial market. It does this by calculating the slope of the source data series, which can be any type of data (such as price, volume, or an oscillator) over a specified length of time. The slope is then normalized, meaning it is transformed to a scale between -1 and 1, with 0 representing a flat trend.
Methodology:
The Normalized Slope script uses an exponential smoothing function to smooth the source data series. The smoothing factor, or alpha, can be adjusted by the user through the input parameter "Pre Smoothing".
Next, the script calculates the slope of the smoothed data series by finding the average difference between the current value and the values of the previous "Length" periods. This slope is then normalized using a function that scales the data to a range of -1 to 1, with 0 representing a flat trend. The normalization function takes the minimum and maximum values of the slope, calculates the difference between them, and then scales the data to the range of -1 to 1.
The normalized slope is then smoothed again using another exponential smoothing function with a user-adjustable smoothing factor (the "Post Smoothing" input parameter). A center line representing a flat trend can also be plotted on the chart by enabling the "Center Line" input parameter. Additionally, the user can choose to display bounds at the -1 and 1 levels by enabling the "Bounds" input parameter.
Conclusion:
The Normalized Slope script provides traders with a visual representation of the strength and direction of a trend in a financial market. It can be used as a standalone indicator or in combination with other technical analysis tools to help traders make informed trading decisions.
Release Notes
Added outlier detection lmfao. Release Notes
added hard clippingRelease Notes
I added a switch to disable hard clipping. Release Notes
you can now fine tune the outlier levelRelease Notes
Major UpdateRelease Notes
minor bug fixRelease Notes
Major UpdateRelease Notes
minor bug fix again?Release Notes
updated bounds minimumOpen-source script
In true TradingView spirit, the creator of this script has made it open-source, so that traders can review and verify its functionality. Kudos to the author! While you can use it for free, remember that republishing the code is subject to our House Rules.
Here are some ways you can contact me:
Toll-Free: +1(800)250-1992
Discord: hikari0001
Telegram: t.me/Jessesanford
Email: info@peaceful.trade
Toll-Free: +1(800)250-1992
Discord: hikari0001
Telegram: t.me/Jessesanford
Email: info@peaceful.trade
Disclaimer
The information and publications are not meant to be, and do not constitute, financial, investment, trading, or other types of advice or recommendations supplied or endorsed by TradingView. Read more in the Terms of Use.
Open-source script
In true TradingView spirit, the creator of this script has made it open-source, so that traders can review and verify its functionality. Kudos to the author! While you can use it for free, remember that republishing the code is subject to our House Rules.
Here are some ways you can contact me:
Toll-Free: +1(800)250-1992
Discord: hikari0001
Telegram: t.me/Jessesanford
Email: info@peaceful.trade
Toll-Free: +1(800)250-1992
Discord: hikari0001
Telegram: t.me/Jessesanford
Email: info@peaceful.trade
Disclaimer
The information and publications are not meant to be, and do not constitute, financial, investment, trading, or other types of advice or recommendations supplied or endorsed by TradingView. Read more in the Terms of Use.