OPEN-SOURCE SCRIPT
SOPR with Z-Score Table
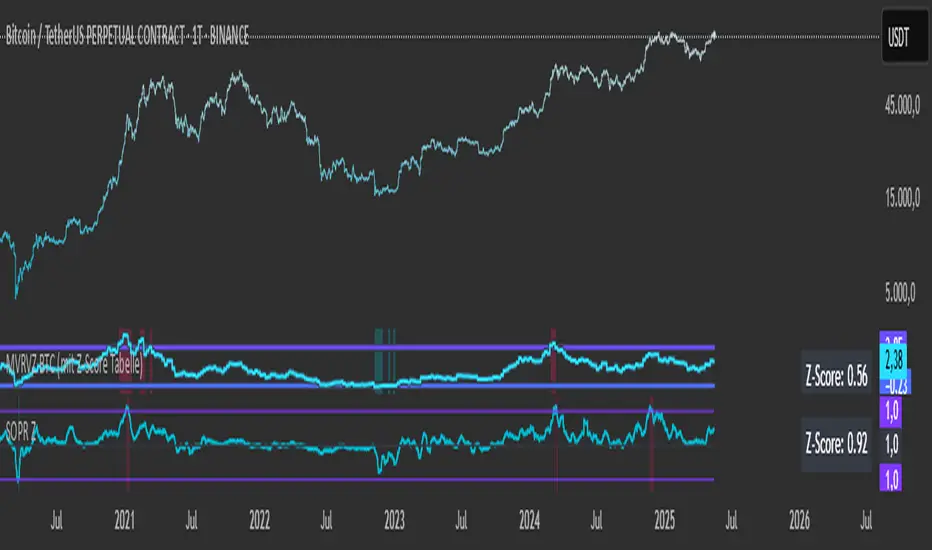
📊 Glassnode SOPR with Dynamic Z-Score Table
ℹ️ Powered by Glassnode On-Chain Metrics
📈 Description:
This indicator visualizes the Spent Output Profit Ratio (SOPR) for major cryptocurrencies — Bitcoin, Ethereum, and Litecoin — along with a dynamically normalized Z-Score. SOPR is a key on-chain metric that reflects whether coins moved on-chain are being sold at a profit or a loss.
🔍 SOPR is calculated using Glassnode’s entity-adjusted SOPR feed, and a custom SMA is applied to smooth the signal. The normalized Z-Score helps identify market sentiment extremes by scaling SOPR relative to its historical context.
📊 Features:
Selectable cryptocurrency: Bitcoin, Ethereum, or Litecoin
SOPR smoothed by user-defined SMA (default: 10 periods)
Upper & lower bounds (±4%) for SOPR, shown as red/green lines
Background highlighting when SOPR moves outside normal range
Normalized Z-Score scaled between –2 and +2
Live Z-Score display in a compact top-right table
🧮 Calculations:
SOPR data is sourced daily from Glassnode:
Bitcoin: XTVCBTC_SOPR
Ethereum: XTVCETH_SOPR
Litecoin: XTVCLTC_SOPR
Z-Score is calculated as:
SMA of SOPR over zscore_length periods
Standard deviation of SOPR
Z-Score = (SOPR – mean) / standard deviation
Z-Score is clamped between –2 and +2 for visual consistency
🎯 Interpretation:
SOPR > 1 implies coins are sold in profit
SOPR < 1 suggests coins are sold at a loss
When SOPR is significantly above or below its recent range (e.g., +4% or –4%), it may signal overheating or capitulation
The Z-Score contextualizes how extreme the current SOPR is relative to history
📌 Notes:
Best viewed on daily charts
Works across selected assets (BTC, ETH, LTC)
Open-source script
In true TradingView spirit, the creator of this script has made it open-source, so that traders can review and verify its functionality. Kudos to the author! While you can use it for free, remember that republishing the code is subject to our House Rules.
Disclaimer
The information and publications are not meant to be, and do not constitute, financial, investment, trading, or other types of advice or recommendations supplied or endorsed by TradingView. Read more in the Terms of Use.