OPEN-SOURCE SCRIPT
Updated Average Daily Liquidity
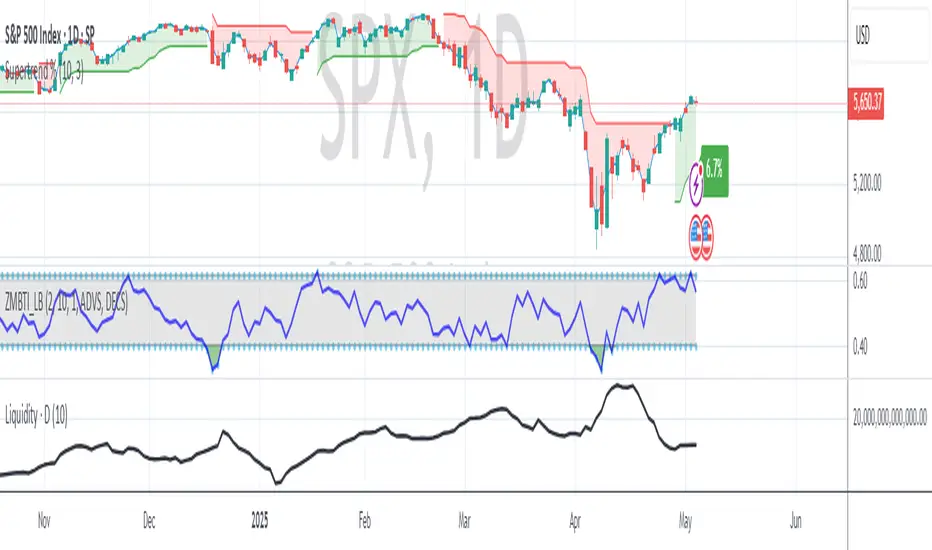
It is important to have sufficient daily trading value (liquidity) to ensure you can easily enter and, importantly, exit the trade. This indicator allows you to see if the traded value of a stock is adequate. The default average is 10 periods and it is common to average the daily traded value as both price and volume can have spikes causing trading errors. Some investors use a 5 period for a week, 10 period for 2 weeks, 20 or 21 period for 4 weeks/month and 65 periods for a quarter. You need to ascertain your buying amount such as $10000 and then have the average daily trading value be your comfortable moving average more such as average liquidity is more than 10 x MA(close x volume) or $100000 in this example. The value is extremely important for small and micro cap stocks you may wish to purchase.
Release Notes
Corrected script to correctly show the required average daily liquidity. Added a tooltip.Open-source script
In true TradingView spirit, the creator of this script has made it open-source, so that traders can review and verify its functionality. Kudos to the author! While you can use it for free, remember that republishing the code is subject to our House Rules.
Disclaimer
The information and publications are not meant to be, and do not constitute, financial, investment, trading, or other types of advice or recommendations supplied or endorsed by TradingView. Read more in the Terms of Use.
Open-source script
In true TradingView spirit, the creator of this script has made it open-source, so that traders can review and verify its functionality. Kudos to the author! While you can use it for free, remember that republishing the code is subject to our House Rules.
Disclaimer
The information and publications are not meant to be, and do not constitute, financial, investment, trading, or other types of advice or recommendations supplied or endorsed by TradingView. Read more in the Terms of Use.