OPEN-SOURCE SCRIPT
Updated Bar Time
Bar Time is a simple utility for traders who rely on backtesting, Bar Replay, and detailed price action analysis. It solves a common but frustrating problem: knowing the exact time of the bar you are looking at.
While most time indicators show your computer's live clock time, this tool displays the bar's own timestamp, perfectly synchronized with your chart's data and timezone.
Why Is This Important?
When you are deep in a Bar Replay session or analyzing a historical setup, the live clock is irrelevant. You need to know when that critical breakout or reversal candle actually happened. Was it during the pre-market? At the London open? In the last five minutes of the US session? This indicator provides that vital context instantly, without you needing to squint at the small print on the x-axis.
Key Use Cases
1. Mastering Bar Replay
As you click through bars in Replay mode, the displayed time updates with each new bar. This allows you to simulate a live trading session with full awareness of the time of day, helping you train your decision-making under more realistic conditions.
2. Analyzing Screener Signals
This is one of the most powerful uses. Imagine your screener finds a "BUY" signal on a stock from two bars ago. You switch to that stock's chart to investigate. Instead of hunting for the exact bar, this tool instantly shows you the date and time of the bar you are currently hovering over. It dramatically speeds up the workflow of moving from a screener alert to actionable analysis.
3. Detailed Price Action Study
Quickly identify key session timings, see how price reacts to news events at a specific time, or analyze intraday volume patterns with complete temporal clarity.
Features & Customization
- The tool is designed to be lightweight, efficient, and fully customizable to match your charting environment.
- Timezone-Aware Accuracy: Automatically detects your chart's timezone for a perfect match between the label and the x-axis.
- Fully Customizable Position: Place the time display in any of nine screen positions (e.g., Top Left, Bottom Center) using a simple dropdown menu.
- Custom Colors: Easily set the background and text colors to blend seamlessly with your chart's theme.
Release Notes
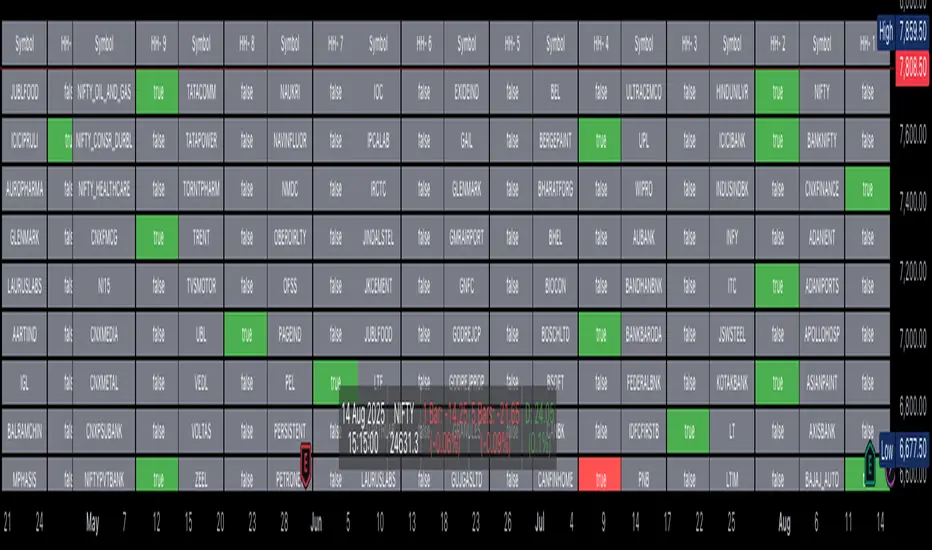
Update: Integrated Index & Market Performance TrackerThis utility now includes a powerful, single-row market performance tracker, giving you immediate context of the broader market without ever leaving your chart. This new feature is displayed right alongside the bar time, creating a comprehensive information panel.
What's New:
- Selectable Index: Track any market index of your choice (the default is NSE:NIFTY) to keep a constant pulse on the broader market. You can change this to SPX, BANKNIFTY, or any other symbol in the settings.
- Live Index Value: See the current price of the selected index, updated in real-time.
- Multi-Timeframe Performance: Instantly gauge market sentiment with three key, color-coded performance metrics, showing both absolute and percentage change:
- D (Daily): Change since the market open for the current day.
- 1D (1-Day): Change from the previous day's close.
- Custom Period (e.g., 5D): Change over a user-defined number of days (the default is 5), perfect for understanding the medium-term trend.
- Full Customization: The new tracker integrates seamlessly with the existing display options. You can now also select the Text Size (from Tiny to Huge) for the entire panel, ensuring perfect readability on any screen.
Release Notes
Update: A Smarter, Cleaner, Single-Row DisplayThe information panel has been completely redesigned for a cleaner and more intelligent user experience. It has a single, dynamic row that automatically adapts to your chart's timeframe.
This enhancement ensures you always see the most relevant market data for your specific analysis, decluttering your chart and streamlining your workflow.
How It Works:
- On Intraday Charts (e.g., 5-min, 1-hour): The panel now prioritizes immediate momentum, which is crucial for intraday trading. It displays:
- 1 Bar Change: The index's move on the very last bar.
- n-Bars Change: Short-term momentum over your custom number of bars.
- Daily Change: The overall daily performance for essential market context.
- On Daily or Higher Charts (e.g., Daily, Weekly): The display automatically transforms to show the macro trend, giving you a broader market perspective. It displays:
- Daily Change: Performance since the market open.
- 1-Day Change: Performance since the previous day's close.
- n-Day Change: The medium-term trend over your custom number of days.
Open-source script
In true TradingView spirit, the creator of this script has made it open-source, so that traders can review and verify its functionality. Kudos to the author! While you can use it for free, remember that republishing the code is subject to our House Rules.
Disclaimer
The information and publications are not meant to be, and do not constitute, financial, investment, trading, or other types of advice or recommendations supplied or endorsed by TradingView. Read more in the Terms of Use.