OPEN-SOURCE SCRIPT
Multiple Ema's
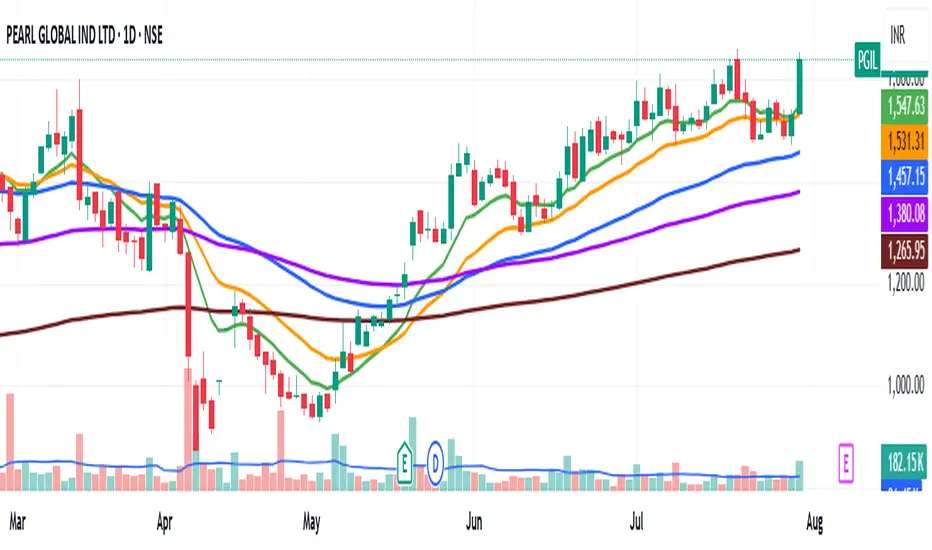
This indicator plots five customizable Exponential Moving Averages (EMAs) directly on your chart, helping you analyze price trends and identify potential support/resistance zones more effectively.
Features:
Five EMAs with adjustable lengths: Quickly set the periods for each EMA (default: 10, 20, 50, 100, 200).
Clear, color-coded lines: Each EMA is plotted with a distinct color for easy visualization:
EMA 1 (Green)
EMA 2 (Orange)
EMA 3 (Blue)
EMA 4 (Purple)
EMA 5 (Brown)
Overlay on price chart: All curves are shown directly on your main chart for seamless trend analysis.
How to Use:
Use this indicator to:
Identify short-, medium-, and long-term trends by observing the relationships and crossovers between the EMAs.
Spot momentum shifts and potential entry/exit opportunities when price crosses above or below multiple EMAs.
Fine-tune EMA periods to your own trading strategy using the input settings.
Ideal for:
Traders and investors seeking a flexible, multi-timeframe EMA solution for stocks, forex, crypto, or any market.
Tip: Experiment with EMA lengths to match your trading style or combine with other indicators for even stronger signals!
Open-source script
In true TradingView spirit, the creator of this script has made it open-source, so that traders can review and verify its functionality. Kudos to the author! While you can use it for free, remember that republishing the code is subject to our House Rules.
Disclaimer
The information and publications are not meant to be, and do not constitute, financial, investment, trading, or other types of advice or recommendations supplied or endorsed by TradingView. Read more in the Terms of Use.