OPEN-SOURCE SCRIPT
Updated Reverse RSI Channel — SharkCIA
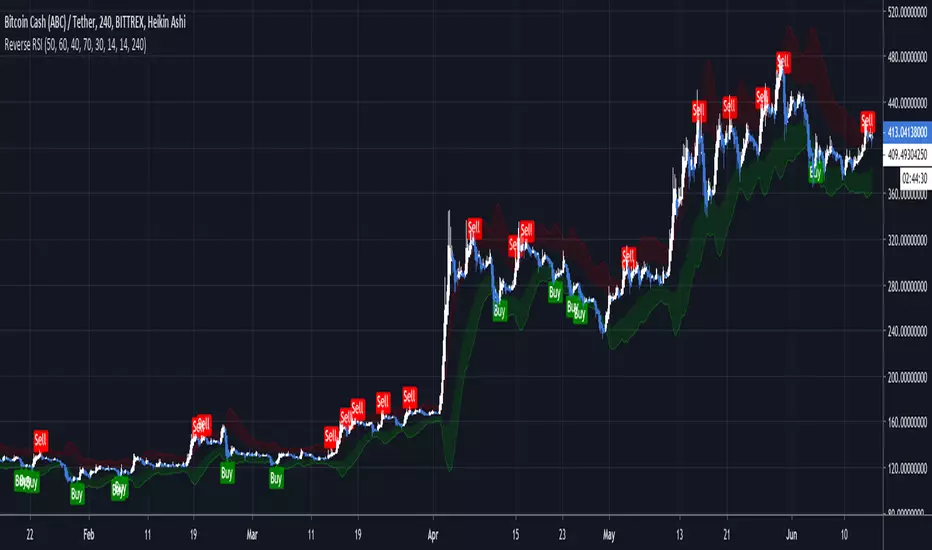
Get a clear picture of trend direction by visualizing RSI levels on your charts.
Green = buy zone, red = sell zone.
The RERSI was first developed by Giorgos Siligardos in the June 2003 issue of Stocks and Commodities Magazine. RERSI plots lines on the price chart that reflect levels of the RSI.
Modified from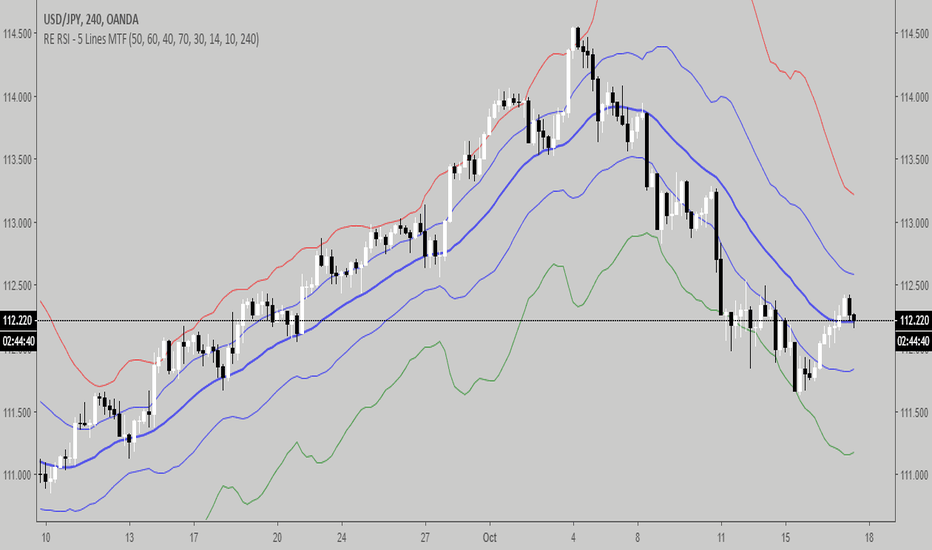
Original implementation by HPotter
Green = buy zone, red = sell zone.
The RERSI was first developed by Giorgos Siligardos in the June 2003 issue of Stocks and Commodities Magazine. RERSI plots lines on the price chart that reflect levels of the RSI.
Modified from
Original implementation by HPotter
Release Notes
Improved transparency & added optional buy/sell signalsOpen-source script
In true TradingView spirit, the creator of this script has made it open-source, so that traders can review and verify its functionality. Kudos to the author! While you can use it for free, remember that republishing the code is subject to our House Rules.
Disclaimer
The information and publications are not meant to be, and do not constitute, financial, investment, trading, or other types of advice or recommendations supplied or endorsed by TradingView. Read more in the Terms of Use.
Open-source script
In true TradingView spirit, the creator of this script has made it open-source, so that traders can review and verify its functionality. Kudos to the author! While you can use it for free, remember that republishing the code is subject to our House Rules.
Disclaimer
The information and publications are not meant to be, and do not constitute, financial, investment, trading, or other types of advice or recommendations supplied or endorsed by TradingView. Read more in the Terms of Use.