OPEN-SOURCE SCRIPT
Updated RSI Cave
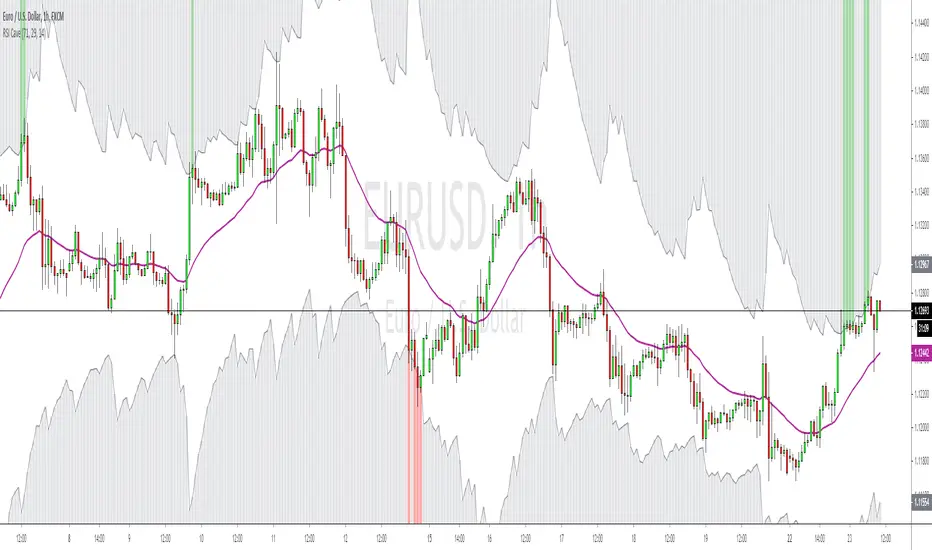
Gives the same info as a conventional RSI oscillator except it's shown as a scary cave that price is trying to avoid touching. An indicator for the more visual traders out there. With thanks to LazyBear for the RSI band code.
I've included an RSI in the chart above for demonstration purposes.
I've included an RSI in the chart above for demonstration purposes.
Release Notes
Added green/red overbought/sold highlights. They can be disabled in optionsRelease Notes
Updated to v4, fixed display issue and added suggestion from commentsRelease Notes
Added RSI centre line (RMA) and option to hide the gray part. Made it more compatible with low sat crypto marketsOpen-source script
In true TradingView spirit, the creator of this script has made it open-source, so that traders can review and verify its functionality. Kudos to the author! While you can use it for free, remember that republishing the code is subject to our House Rules.
Disclaimer
The information and publications are not meant to be, and do not constitute, financial, investment, trading, or other types of advice or recommendations supplied or endorsed by TradingView. Read more in the Terms of Use.
Open-source script
In true TradingView spirit, the creator of this script has made it open-source, so that traders can review and verify its functionality. Kudos to the author! While you can use it for free, remember that republishing the code is subject to our House Rules.
Disclaimer
The information and publications are not meant to be, and do not constitute, financial, investment, trading, or other types of advice or recommendations supplied or endorsed by TradingView. Read more in the Terms of Use.