OPEN-SOURCE SCRIPT
Updated GRJMOM - Risk-Adjusted Momentum
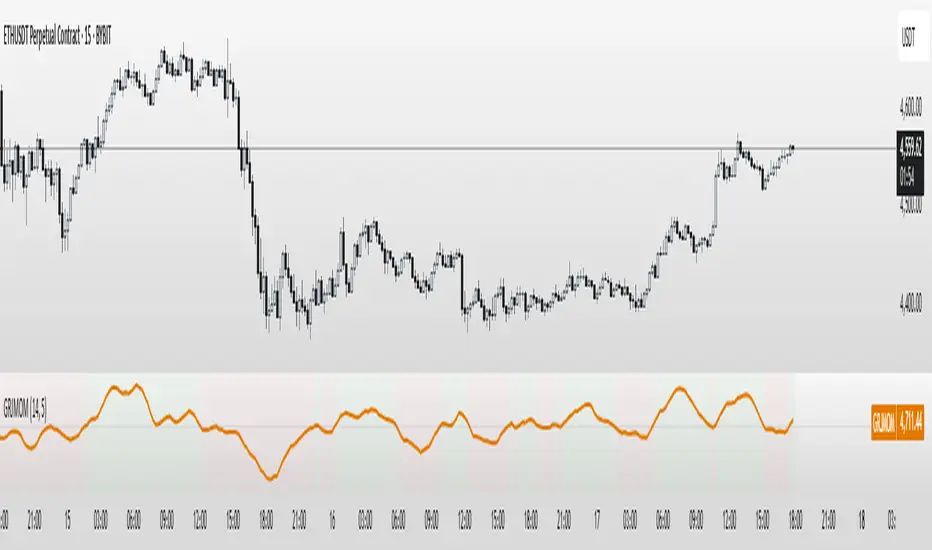
GRJMOM – Risk-Adjusted Momentum
GRJMOM stands for Generalized Risk-Adjusted Momentum. This indicator adjusts traditional momentum by dividing it by realized volatility over the same formation period. The result is a cleaner, more risk-sensitive momentum signal designed to avoid momentum crashes and volatility-driven false breakouts.
How it works:
Calculates raw momentum: Close - Close[N]
Computes realized volatility using standard deviation of log returns
Outputs a risk-adjusted momentum score (Momentum / Volatility)
Optional smoothing can be applied to reduce short-term noise
Background coloring highlights bullish (green) and bearish (red) regimes
Use Cases:
GRJMOM > 0 suggests a bullish risk-adjusted trend
GRJMOM < 0 indicates a weakening or bearish trend
Can be used as a trend confirmation filter
Pairs well with cycle indicators like HHT or FFT for timing
Best for:
Swing traders, trend followers, and systematic strategy builders looking for smarter momentum signals with built-in risk awareness
Release Notes
Updated chartRelease Notes
GRJMOM - Risk-Adjusted MomentumOverview:
GRJMOM (Generalized Risk-Adjusted Momentum) modifies traditional momentum calculations by normalizing them against realized volatility over the same measurement period. This approach scales momentum relative to the underlying price volatility rather than using absolute price change values.
Technical Methodology:
Raw Momentum Calculation: Current close minus close N periods ago
Realized Volatility: Standard deviation of logarithmic returns over the same N-period window
Risk Adjustment: Momentum value divided by realized volatility to create a normalized ratio
Optional Smoothing: Exponential moving average can be applied to reduce signal noise
Visual Elements: Background coloring indicates positive (green) or negative (red) values
Parameters:
Lookback Period (N): Number of bars used for both momentum and volatility calculations
Smoothing Length: Period for optional exponential moving average smoothing
Color Settings: Background highlighting options for visual interpretation
Calculation Logic:
The indicator attempts to distinguish between momentum driven by genuine price trends versus momentum created by high volatility environments. By dividing momentum by volatility, it theoretically provides context for whether price movement represents consistent directional bias or random price fluctuation.
Interpretation Framework:
Positive values suggest upward momentum relative to recent volatility levels
Negative values indicate downward momentum relative to recent volatility levels
Values near zero may indicate ranging or transitional market conditions
Important Limitations:
Volatility normalization can produce unstable readings during very low volatility periods
The relationship between momentum and volatility varies significantly across different market regimes
Risk adjustment does not eliminate the inherent lagging nature of momentum-based calculations
Effectiveness depends heavily on the chosen lookback period and market characteristics
Should not be used as a standalone trading system without additional confirmation
Technical Considerations:
This indicator modifies momentum calculation methodology but does not predict future price direction. Users should thoroughly backtest across different market conditions and timeframes to understand its behavior patterns before implementation.
Open-source script
In true TradingView spirit, the creator of this script has made it open-source, so that traders can review and verify its functionality. Kudos to the author! While you can use it for free, remember that republishing the code is subject to our House Rules.
Disclaimer
The information and publications are not meant to be, and do not constitute, financial, investment, trading, or other types of advice or recommendations supplied or endorsed by TradingView. Read more in the Terms of Use.