OPEN-SOURCE SCRIPT
Williams %R + Keltner chanells - indicator (AS)
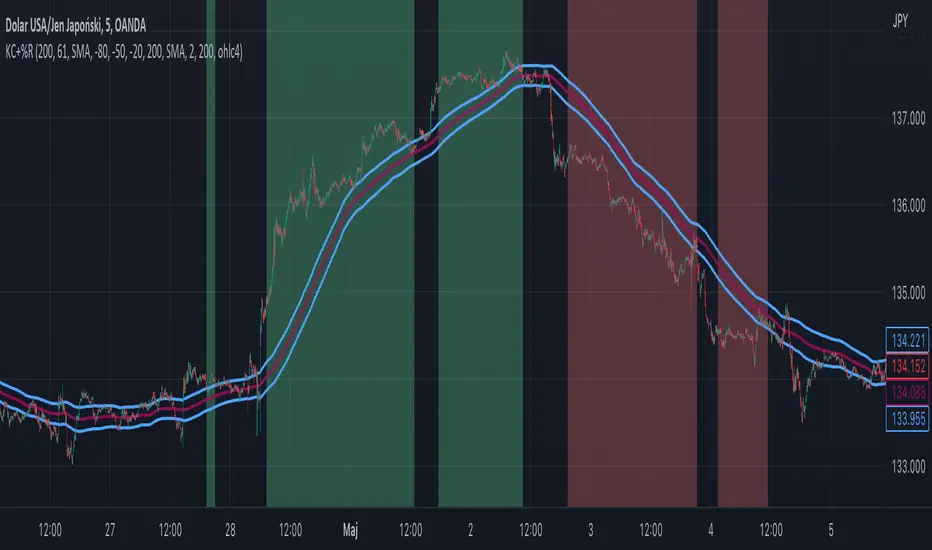
1)INDICATOR ---This indicator is a combination of Keltner channels and Williams %R.
It measures trend using these two indicators.
When Williams %R is overbought(above upper line (default=-20)) and Keltner lower line is below price indicator shows uptrend (green).
When Williams %R is oversold(below lower line (default=-80)) and Keltner upper line is above price indicator shows downtrend (red) .
Can be turned into a strategy quickly.
2) CALCULATIONS:
Keltner basis is a choosen type of moving average and upper line is basis + (ATR*multiplier). Same with lower but minus instead of plus so basiss – (ATR*multiplier)
Second indicator
Williams %R reflects the level of the close relative to the highest high for the lookback period
3)PLS-HELP-----Looking for tips, ideas, sets of parameters, markets and timeframes, rules for strategy -------OVERALL -every advice you can have
4) SIGNALS-----buy signal is when price is above upper KC and Williams %R is above OVB(-20). Short is exactly the other way around
5) CUSTOMIZATION:
-%R-------LENGTH/SMOOTHING/TYPE SMOOTHING MA
-%R-------OVS/MID/OVB -(MID-no use for now)
-KC -------LENGTH/TYPE OF MAIN MA
-KC-------MULTIPLIER,ATR LENGTH
-OTHER--LENGTH/TYPE OF MA - (for signal filters, not used for now)
-OTHER--SOURCE -src of calculations
-OTHER--OVERLAY - plots %R values for debugging etc(ON by default)
6)WARNING - do not use this indicator on its own for trading
7)ENJOY
Open-source script
In true TradingView spirit, the creator of this script has made it open-source, so that traders can review and verify its functionality. Kudos to the author! While you can use it for free, remember that republishing the code is subject to our House Rules.
Disclaimer
The information and publications are not meant to be, and do not constitute, financial, investment, trading, or other types of advice or recommendations supplied or endorsed by TradingView. Read more in the Terms of Use.