OPEN-SOURCE SCRIPT
Volume Imbalance Heatmap + Delta Cluster [@darshakssc]
🔥 Volume Imbalance Heatmap + Delta Cluster
Created by: darshakssc
This indicator is designed to visually reveal institutional pressure zones using a combination of:
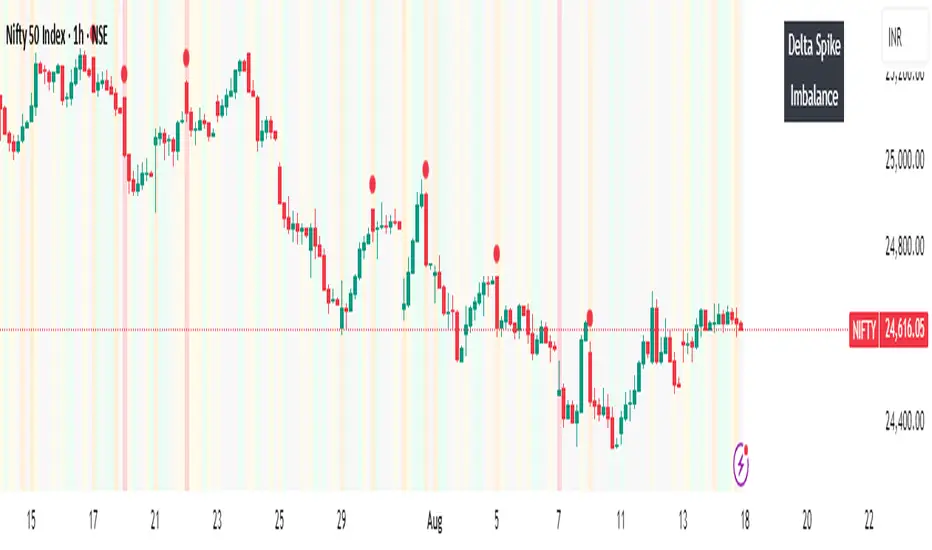
🔺 Delta Cluster Detection: Highlights candles with strong body ratios and volume spikes, helping identify aggressive buying or selling activity.
🌡️ Real-Time Heatmap Overlay: Background color dynamically adjusts based on volume imbalance relative to its moving average.
🧠 Adaptive Dashboard: Displays live insights into current market imbalance and directional flow (Buy/Sell clusters).
📈 How It Works:
A candle is marked as a Buy Cluster if it closes bullish, has a strong body, and exhibits a volume spike above average.
A Sell Cluster triggers under the inverse conditions.
The heatmap shades the chart background to reflect areas of high or low imbalance using a color gradient.
⚙️ Inputs You Can Adjust:
Volume MA Length
Minimum Body Ratio
Imbalance Multiplier Sensitivity
Dashboard Location
🚫 Note: This is not a buy/sell signal tool, but a visual aid to support institutional flow tracking and confluence with your existing system.
For educational use only. Not financial advice.
Created by: darshakssc
This indicator is designed to visually reveal institutional pressure zones using a combination of:
🔺 Delta Cluster Detection: Highlights candles with strong body ratios and volume spikes, helping identify aggressive buying or selling activity.
🌡️ Real-Time Heatmap Overlay: Background color dynamically adjusts based on volume imbalance relative to its moving average.
🧠 Adaptive Dashboard: Displays live insights into current market imbalance and directional flow (Buy/Sell clusters).
📈 How It Works:
A candle is marked as a Buy Cluster if it closes bullish, has a strong body, and exhibits a volume spike above average.
A Sell Cluster triggers under the inverse conditions.
The heatmap shades the chart background to reflect areas of high or low imbalance using a color gradient.
⚙️ Inputs You Can Adjust:
Volume MA Length
Minimum Body Ratio
Imbalance Multiplier Sensitivity
Dashboard Location
🚫 Note: This is not a buy/sell signal tool, but a visual aid to support institutional flow tracking and confluence with your existing system.
For educational use only. Not financial advice.
Open-source script
In true TradingView spirit, the creator of this script has made it open-source, so that traders can review and verify its functionality. Kudos to the author! While you can use it for free, remember that republishing the code is subject to our House Rules.
Disclaimer
The information and publications are not meant to be, and do not constitute, financial, investment, trading, or other types of advice or recommendations supplied or endorsed by TradingView. Read more in the Terms of Use.