OPEN-SOURCE SCRIPT
Rolling Beta against SPY
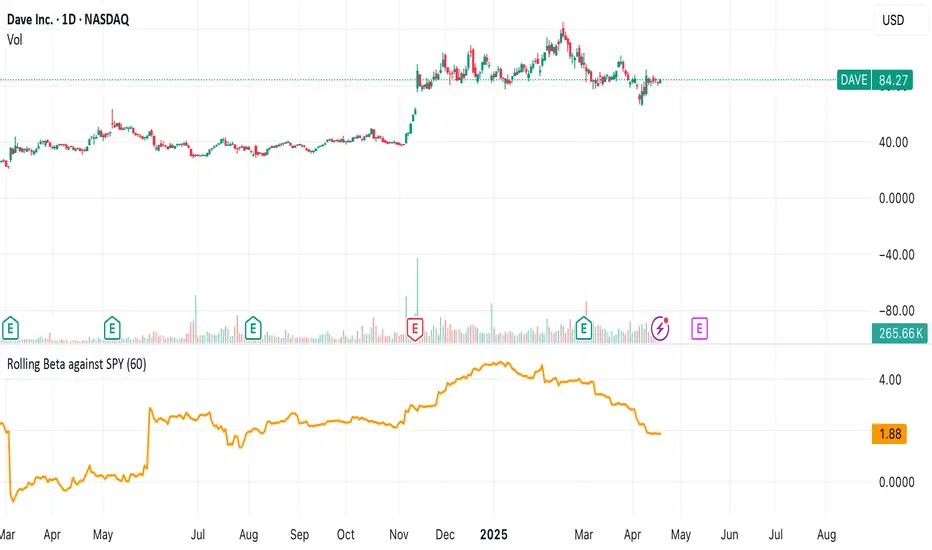
📈 Pine Script Showcase: Rolling Beta Against SPY
Understanding how your favorite stock or ETF moves in relation to a benchmark like the S&P 500 can offer powerful insights into risk and exposure. This script calculates and visualizes the rolling beta of any asset versus the SPY ETF (which tracks the S&P 500).
🧠 What Is Beta?
Beta measures the sensitivity of an asset's returns to movements in the broader market. A beta of:
- 1.0 means the asset moves in lockstep with SPY,
- >1.0 indicates higher volatility than the market,
- <1.0 implies lower volatility or possible defensive behavior,
- <0 suggests inverse correlation (e.g., hedging instruments).
🧮 How It Works
This script computes rolling beta over a user-defined window (default = 60 periods) using classic linear regression math:
- Calculates daily returns for both the asset and SPY.
- Computes covariance between the two return streams.
- Divides by the variance of SPY returns to get beta.
⚙️ Customization
You can adjust the window size to control the smoothing:
- Shorter windows capture recent volatility changes,
- Longer windows give more stable, long-term estimates.
📊 Visual Output
The script plots the beta series dynamically, allowing you to observe how your asset’s correlation to SPY evolves over time. This is especially useful in regime-change environments or during major macroeconomic shifts.
💡 Use Cases
- Portfolio construction: Understand how your assets co-move with the market.
- Risk management: Detect when beta spikes—potentially signaling higher market sensitivity.
- Market timing: Use beta shifts to infer changing investor sentiment or market structure.
📌 Pro Tip: Combine this rolling beta with volatility, Sharpe ratio, or correlation tracking for a more robust factor-based analysis.
Ready to add a layer of quantitative insight to your chart? Add the script to your watchlist and start analyzing your favorite tickers against SPY today!
Open-source script
In true TradingView spirit, the creator of this script has made it open-source, so that traders can review and verify its functionality. Kudos to the author! While you can use it for free, remember that republishing the code is subject to our House Rules.
Disclaimer
The information and publications are not meant to be, and do not constitute, financial, investment, trading, or other types of advice or recommendations supplied or endorsed by TradingView. Read more in the Terms of Use.