OPEN-SOURCE SCRIPT
Updated Zigzag Trend-based Color [SteinG]
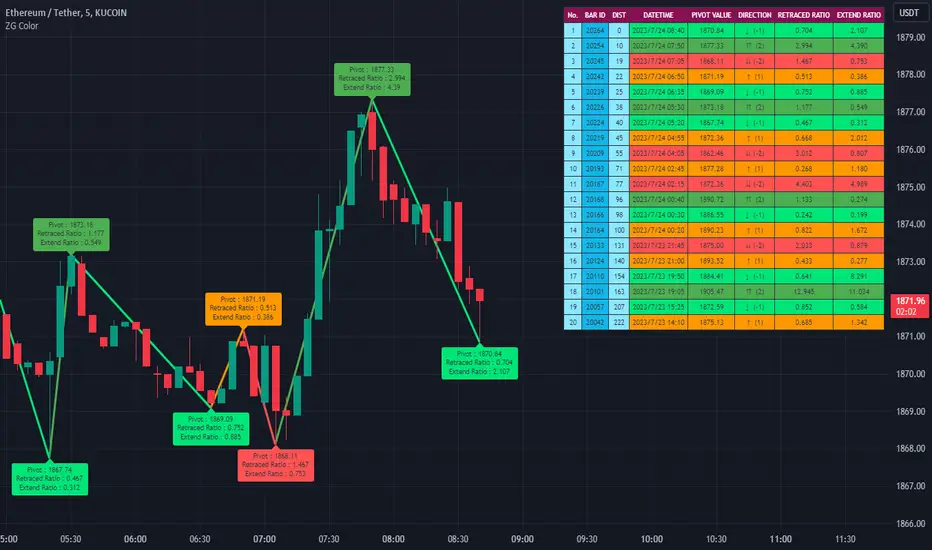
Zigzag Indicator with Trend-based Color Coding and Info Table
This indicator is forked from Trendoscope's Recursive Zigzag
The Zigzag Indicator with Trend-based Color Coding and Info Table is a powerful tool for technical analysis, designed to help you identify significant price swings, visualize trends, and analyze pivot points with ease. This advanced indicator offers enhanced functionalities and improved visual representation.
The primary purpose of the Zigzag Indicator is to identify and highlight important price reversals, commonly referred to as pivot points, in a given chart. These pivot points are essential in recognizing trend changes and potential market turning points. With the Zigzag Indicator, you can quickly identify these pivotal moments and gain valuable insights into market dynamics.
One of the standout features of this indicator is the color coding applied to the Zigzag line, which intuitively reflects the trend associated with each pivot point. The color scheme is as follows:
- Green: Indicates an upward trend, representing a bullish movement in the price.
- Lime: Represents a retracement during an upward trend, indicating a temporary pullback before the uptrend resumes.
- Red: Signifies a downward trend, indicating a bearish movement in the price.
- Orange: Represents a retracement during a downward trend, indicating a temporary bounce before the downtrend resumes.
This color coding allows you to easily visualize the prevailing market sentiment and make more informed trading decisions accordingly.
In addition to the visual representation, the Zigzag Indicator also includes an informative table that provides essential details about each pivot point. The table presents the following information for each pivot point:
1. Pivot Value: The price level at which the pivot point occurs.
2. Direction: Indicates whether the pivot point represents an upward or downward trend.
3. Fibo Ratios: Displays the Fibonacci retracement levels between two consecutive pivot points, offering insights into potential support and resistance levels.
The inclusion of this comprehensive info table enables you to analyze pivot points more effectively, understand the underlying price dynamics, and identify key trading opportunities.
Release Notes
v2Use Open Close Prices added
You can use open close prices for calculating pivots instead of high/low.
Release Notes
V31. DATETIME added to table
2. PIVOT VALUE decimal place fixed
3. Remove unused function
Release Notes
v4Minor fix
Release Notes
v5typo fixed
Open-source script
In true TradingView spirit, the creator of this script has made it open-source, so that traders can review and verify its functionality. Kudos to the author! While you can use it for free, remember that republishing the code is subject to our House Rules.
Disclaimer
The information and publications are not meant to be, and do not constitute, financial, investment, trading, or other types of advice or recommendations supplied or endorsed by TradingView. Read more in the Terms of Use.