OPEN-SOURCE SCRIPT
Updated Wick Delta Buy/Sell Pressure
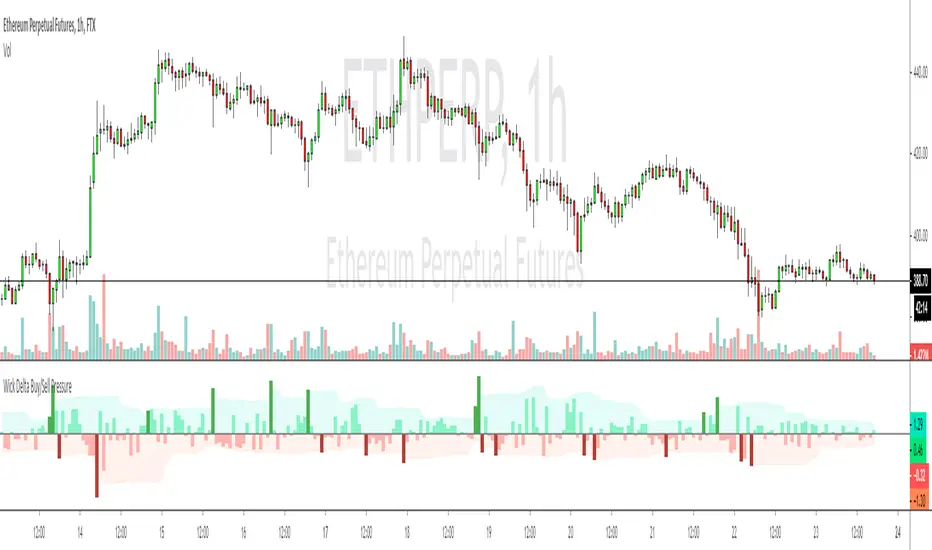
If you think of a perfect doji candle, where the wicks on top and bottom are exactly the same, that's a candle with a delta of 0. What this indicator does is show the delta/difference between wicks, if the top wick is longer than the bottom wick it show's sell pressure/bear interest, which is displayed as a red bar and vice versa for buy/bull pressure, which is shown as green bars. I added arrows for clarity.
It's a different way of visualising wicks, which can clarify sentiment and be a useful way to understand wicks better in general. One way to use it is to look for clusters of 3/4 larger bars in a row, which generally helps to determine future direction especially when seen at important levels.
It's a different way of visualising wicks, which can clarify sentiment and be a useful way to understand wicks better in general. One way to use it is to look for clusters of 3/4 larger bars in a row, which generally helps to determine future direction especially when seen at important levels.
Release Notes
Updated to highlight the bigger/more important wicksOpen-source script
In true TradingView spirit, the creator of this script has made it open-source, so that traders can review and verify its functionality. Kudos to the author! While you can use it for free, remember that republishing the code is subject to our House Rules.
Disclaimer
The information and publications are not meant to be, and do not constitute, financial, investment, trading, or other types of advice or recommendations supplied or endorsed by TradingView. Read more in the Terms of Use.
Open-source script
In true TradingView spirit, the creator of this script has made it open-source, so that traders can review and verify its functionality. Kudos to the author! While you can use it for free, remember that republishing the code is subject to our House Rules.
Disclaimer
The information and publications are not meant to be, and do not constitute, financial, investment, trading, or other types of advice or recommendations supplied or endorsed by TradingView. Read more in the Terms of Use.