OPEN-SOURCE SCRIPT
Updated Pro Momentum Calculator
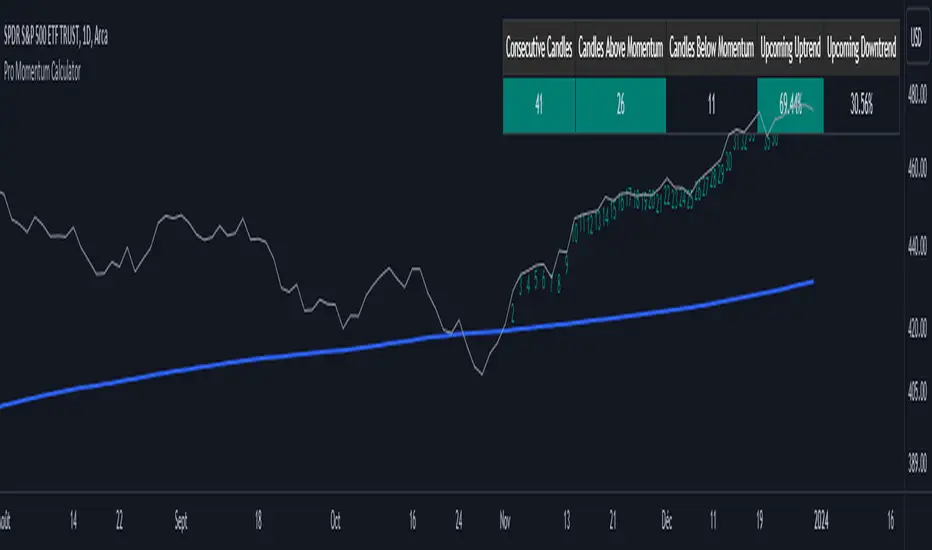
The Pro Momentum Calculator Indicator is a tool for traders seeking to gauge market momentum and predict future price movements. It achieves this by counting consecutive candle periods above or below a chosen Simple Moving Average (SMA) and then providing a percentage-based probability for the direction of the next candle.
Here's how this principle works:
1. Counting Consecutive Periods: The indicator continuously tracks whether the closing prices of candles are either above or below the chosen SMA.
- When closing prices are above the SMA, it counts consecutive periods as "green" or indicating potential upward momentum.
- When closing prices are below the SMA, it counts consecutive periods as "red" or suggesting potential downward momentum.
2. Assessing Momentum: By monitoring these consecutive periods, the indicator assesses the strength and duration of the current market trend.
This is important information for traders looking to understand the market's behavior.
3. Predicting the Next Candle: Based on the historical data of consecutive green and red periods, the indicator calculates a percentage probability for the direction of the next candle:
- If there have been more consecutive green periods, it suggests a higher likelihood of the next candle being green (indicating a potential upward movement).
- If there have been more consecutive red periods, it suggests a higher likelihood of the next candle being red (indicating a potential downward movement).
The Pro Momentum Calculator indicator's versatility makes it suitable for a wide range of financial markets, including stocks, Forex, indices, commodities, cryptocurrencies...
Release Notes
Option to use Heikin Ashi candles removedRelease Notes
minor changesRelease Notes
EMA calculation added in addition to SMARelease Notes
Minor changesRelease Notes
Minor adjustments madeOpen-source script
In true TradingView spirit, the creator of this script has made it open-source, so that traders can review and verify its functionality. Kudos to the author! While you can use it for free, remember that republishing the code is subject to our House Rules.
The trend is your friend, until it's not...
Disclaimer
The information and publications are not meant to be, and do not constitute, financial, investment, trading, or other types of advice or recommendations supplied or endorsed by TradingView. Read more in the Terms of Use.
Open-source script
In true TradingView spirit, the creator of this script has made it open-source, so that traders can review and verify its functionality. Kudos to the author! While you can use it for free, remember that republishing the code is subject to our House Rules.
The trend is your friend, until it's not...
Disclaimer
The information and publications are not meant to be, and do not constitute, financial, investment, trading, or other types of advice or recommendations supplied or endorsed by TradingView. Read more in the Terms of Use.