OPEN-SOURCE SCRIPT
Pre-Market High and Low
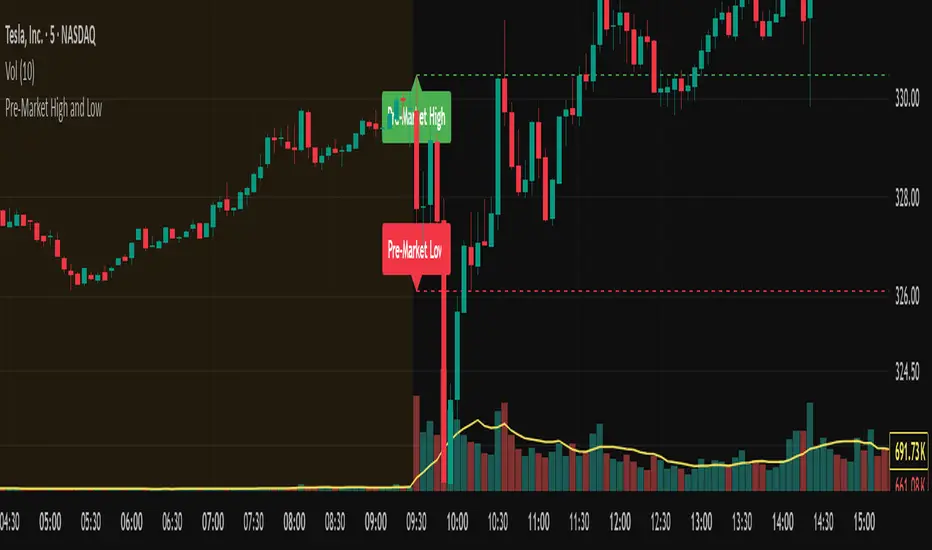
This indicator automatically tracks and plots the daily pre-market high and low levels on your chart for U.S. stocks. It monitors the pre-market session from 4:30 AM to 9:30 AM Eastern Time (New York) and captures the highest and lowest prices during this period.
At exactly 9:30 AM ET, when the regular market opens, the indicator draws dashed horizontal lines representing the pre-market high and pre-market low, extending them forward for better visibility throughout the trading day.
At exactly 9:30 AM ET, when the regular market opens, the indicator draws dashed horizontal lines representing the pre-market high and pre-market low, extending them forward for better visibility throughout the trading day.
Open-source script
In true TradingView spirit, the creator of this script has made it open-source, so that traders can review and verify its functionality. Kudos to the author! While you can use it for free, remember that republishing the code is subject to our House Rules.
Disclaimer
The information and publications are not meant to be, and do not constitute, financial, investment, trading, or other types of advice or recommendations supplied or endorsed by TradingView. Read more in the Terms of Use.