OPEN-SOURCE SCRIPT
Updated Sector Relative Strength
Description
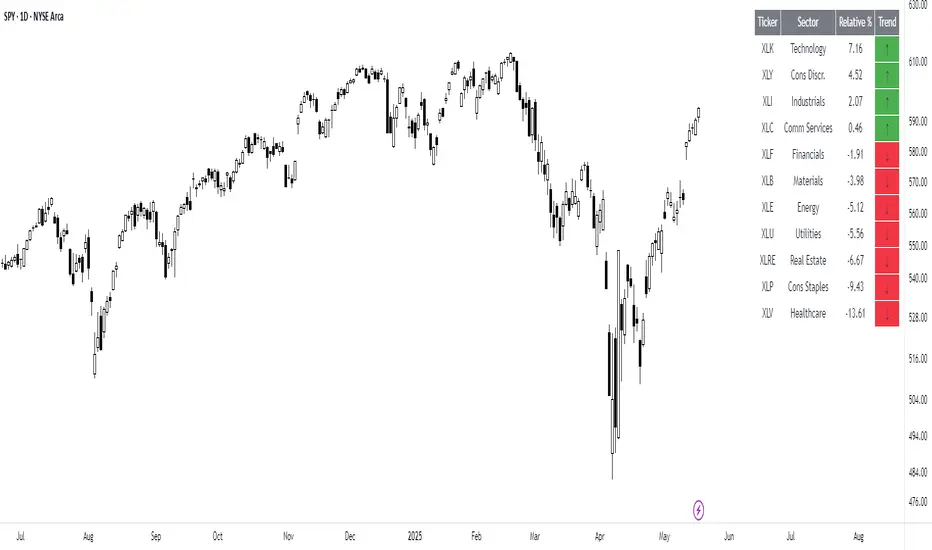
This script compares sector performance relative to the S&P 500. Sector price levels or charts alone can mislead, because they tend to move with the broader market. An increase in a sector’s price does not necessarily indicate strength, as it may simply be following the index.
For more a more reliable picture, the script calculates a ratio between each sector ETF and SPY. If the ratio has increased, the sector has outperformed the index. In case it has declined, the sector has underperformed. If the value is near zero, the sector has moved in line with the index. The sectors are presented in a table and sorted on relative performance.
Calculation Method
The performance is expressed as a percentage change in the ratio over a user-defined lookback period. The default lookback is set to 21 bars, which corresponds to one month on a daily chart. This value can be adopted in the settings to match preferred time period.
Z-Score
In addition to the percentage change, the script calculates a Z-score of the ratio, which measures how far the current value deviates from its recent mean. A high positive Z-score indicates that the ratio is significantly above its average, while a negative value indicates it is below. This normalization allows for comparison between sectors with different price levels or volatility profiles.
Table Columns
- Relative %: The sector's performance relative to SPY over the selected lookback period
- Z-Score: Standardized measure of current performance ratio is relative to its average
- Trend Arrow: Indicates the direction of relative performance up down or flat
Example Interpretation
For example, if XLK shows a 3.7% change, it has outperformed SPY over the selected period. Another sector might show a -2.1% change, which indicates underperformance. While both values shows relative strength or weakness, the Z-score is optional and can provide additional context based on how unusual that performance is compared to the sector's own recent behavior.
Use Case
This approach helps evaluate overall market conditions and supports a top-down method. By starting with sector performance, it becomes easier to identify where the market is showing leadership or weakness. This allows the stock selection process to be more deliberate and can help refine or customize screeners based on certain sectors.
Release Notes
* Fixed a script error where values were affected by the chart's timeframe and symbol selection, all calculations now use consistent daily data.* Script is now slightly heavier due to per-symbol daily requests, but is more stable.
* Removed Z-score column to improve clarity and significantly boost performance.
* Added dropdown menu for selecting lookback period (1D to 1Y) instead of manual bar input.
Release Notes
LabelsOpen-source script
In true TradingView spirit, the creator of this script has made it open-source, so that traders can review and verify its functionality. Kudos to the author! While you can use it for free, remember that republishing the code is subject to our House Rules.
Technical Trading: Research and Application
stockleave.com/
stockleave.com/
Disclaimer
The information and publications are not meant to be, and do not constitute, financial, investment, trading, or other types of advice or recommendations supplied or endorsed by TradingView. Read more in the Terms of Use.
Open-source script
In true TradingView spirit, the creator of this script has made it open-source, so that traders can review and verify its functionality. Kudos to the author! While you can use it for free, remember that republishing the code is subject to our House Rules.
Technical Trading: Research and Application
stockleave.com/
stockleave.com/
Disclaimer
The information and publications are not meant to be, and do not constitute, financial, investment, trading, or other types of advice or recommendations supplied or endorsed by TradingView. Read more in the Terms of Use.