OPEN-SOURCE SCRIPT
Updated Multi-Timeframe Stoch RSI
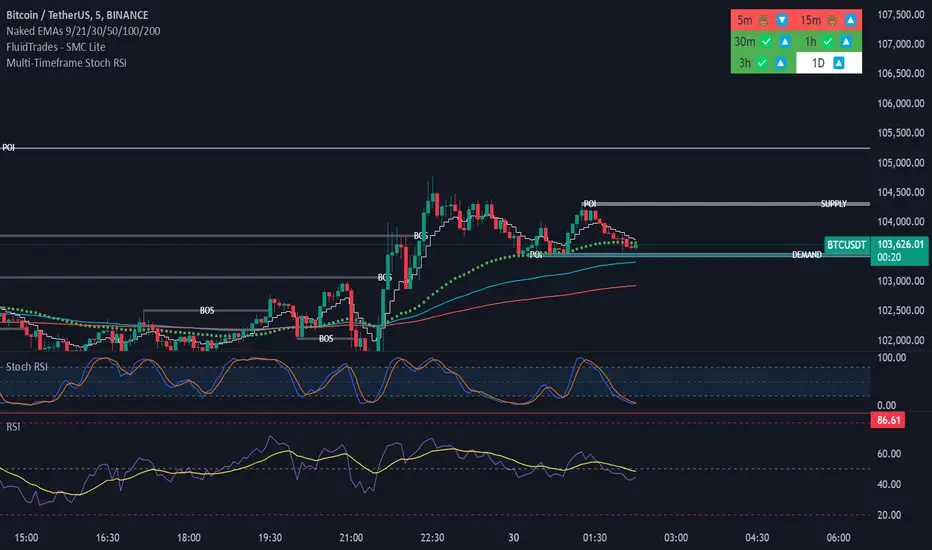
The Multi-Timeframe Stoch RSI Indicator analyzes Stochastic RSI values across multiple timeframes (5m, 15m, 30m, 1h, 3h, and 1D) to help identify overbought and oversold conditions. It displays a visual table where each timeframe is color-coded—red for overbought (🐻) and green for oversold (✅)—allowing traders to quickly assess market momentum at different intervals. This helps in making informed trading decisions based on multi-timeframe confluence.
Release Notes
The Multi-Timeframe Stoch RSI Indicator analyzes Stochastic RSI values across multiple timeframes (5m, 15m, 30m, 1h, 3h, and 1D) to help identify overbought and oversold conditions. It displays a visual table where each timeframe is color-coded—red for overbought (🐻) and green for oversold (✅)—allowing traders to quickly assess market momentum at different intervals. This helps in making informed trading decisions based on multi-timeframe confluence.Added RSI conditions to the table, displaying an upward arrow (🔼) if RSI is above 50 and a downward arrow (🔽) if RSI is below 50.
Open-source script
In true TradingView spirit, the creator of this script has made it open-source, so that traders can review and verify its functionality. Kudos to the author! While you can use it for free, remember that republishing the code is subject to our House Rules.
Disclaimer
The information and publications are not meant to be, and do not constitute, financial, investment, trading, or other types of advice or recommendations supplied or endorsed by TradingView. Read more in the Terms of Use.