OPEN-SOURCE SCRIPT
Volume-Based Candle Shading
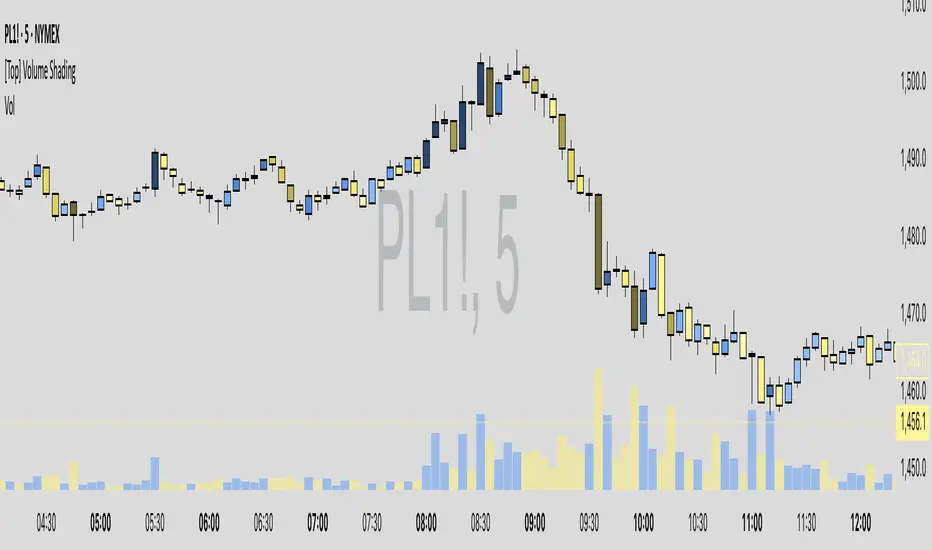
The [Top] Volume Shading indicator dynamically adjusts the color brightness of each price bar based on relative volume levels. It helps traders quickly identify whether a candle formed on low, average, or high volume without needing to reference a separate volume pane.
Candles are shaded dynamically as they form, so you can watch volume flow into them in real time. This indicator is designed to be as minimally intrusive as possible, allowing you to visualize volume levels without extra clutter on your charts.
The additional volume indicator in the preview above is there just for a point of reference to allow you to see how the shading on the bars correlates to the volume.
⸻
SETTINGS:
Candles with volume above average will appear darker or lighter depending on user preference, while those with average volume will be painted the chosen colors, giving an intuitive gradient that enhances volume awareness directly on the chart.
⸻
USES:
Candles are shaded dynamically as they form, so you can watch volume flow into them in real time. This indicator is designed to be as minimally intrusive as possible, allowing you to visualize volume levels without extra clutter on your charts.
The additional volume indicator in the preview above is there just for a point of reference to allow you to see how the shading on the bars correlates to the volume.
⸻
SETTINGS:
- Bullish and bearish base colors — These serve as the midpoint (average volume) for shading.
- Brightness mapping direction — Optionally invert the shading so that either high volume appears darker or lighter.
- Volume smoothing length — Defines how many bars are averaged to determine what constitutes “normal” volume.
Candles with volume above average will appear darker or lighter depending on user preference, while those with average volume will be painted the chosen colors, giving an intuitive gradient that enhances volume awareness directly on the chart.
⸻
USES:
- Confirming price action: Highlight when breakout candles or reversal bars occur with high relative volume, strengthening signal conviction.
- Spotting low-volume moves: Identify candles that lack volume support, potentially signaling weak continuation or false breakouts.
- Enhancing visual analysis: Overlay volume dynamics directly onto price bars, reducing screen clutter and aiding faster decision-making.
- Custom visual workflows: Adapt the visual behavior of candles to your trading style by choosing color direction and base tones.
Open-source script
In true TradingView spirit, the creator of this script has made it open-source, so that traders can review and verify its functionality. Kudos to the author! While you can use it for free, remember that republishing the code is subject to our House Rules.
Disclaimer
The information and publications are not meant to be, and do not constitute, financial, investment, trading, or other types of advice or recommendations supplied or endorsed by TradingView. Read more in the Terms of Use.