OPEN-SOURCE SCRIPT
Updated ICT Friday's Asian Range°
This concept was engineered and taught by the Inner Circle Trader.
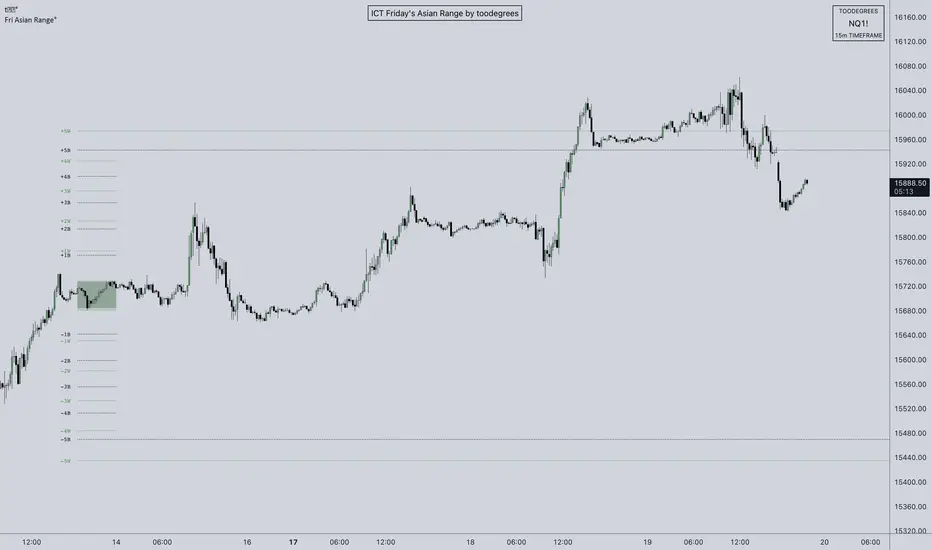
The goal of this script is to outline a potential draw on liquidity for the next trading week. It gives a parameter for ICT PD Arrays to be located above and below the marketplace and should be used in conjunction with the higher Timeframe Arrays as defined by ICT.
If there is a higher Timeframe array with a standard deviation confluence of the Friday Asian Range it is considered high probability for price to reach up/down to that level, and present a potential retracement or reversal.
The Asian Range is defined as the window of Time between 7PM to Midnight New York Time. In this case we will be only using the Friday's Asian Range which will take place on Thursday between these Times.
We have two ranges: a Body range made of the highest and lowest candle bodies, and a Wick range made by the highest and lowest candle wicks.
ICT teaches that we only want to apply this concept to the 5minute and 15minute chart.
THIS SCRIPT WILL NOT WORK ON ANY OTHER TIMEFRAME OUT OF THE BOX
Framework:

Visualization:

Example:
https://tradingview.sweetlogin.com/x/YRDTcQJj/
The goal of this script is to outline a potential draw on liquidity for the next trading week. It gives a parameter for ICT PD Arrays to be located above and below the marketplace and should be used in conjunction with the higher Timeframe Arrays as defined by ICT.
If there is a higher Timeframe array with a standard deviation confluence of the Friday Asian Range it is considered high probability for price to reach up/down to that level, and present a potential retracement or reversal.
The Asian Range is defined as the window of Time between 7PM to Midnight New York Time. In this case we will be only using the Friday's Asian Range which will take place on Thursday between these Times.
We have two ranges: a Body range made of the highest and lowest candle bodies, and a Wick range made by the highest and lowest candle wicks.
ICT teaches that we only want to apply this concept to the 5minute and 15minute chart.
THIS SCRIPT WILL NOT WORK ON ANY OTHER TIMEFRAME OUT OF THE BOX
Framework:
Visualization:
Example:
https://tradingview.sweetlogin.com/x/YRDTcQJj/
Release Notes
Minor Code Clean UpRelease Notes
Bug Fix: alert trigger bug where some stdevs were not triggering fixedOpen-source script
In true TradingView spirit, the creator of this script has made it open-source, so that traders can review and verify its functionality. Kudos to the author! While you can use it for free, remember that republishing the code is subject to our House Rules.
homo faber fortunæ suæ
Disclaimer
The information and publications are not meant to be, and do not constitute, financial, investment, trading, or other types of advice or recommendations supplied or endorsed by TradingView. Read more in the Terms of Use.
Open-source script
In true TradingView spirit, the creator of this script has made it open-source, so that traders can review and verify its functionality. Kudos to the author! While you can use it for free, remember that republishing the code is subject to our House Rules.
homo faber fortunæ suæ
Disclaimer
The information and publications are not meant to be, and do not constitute, financial, investment, trading, or other types of advice or recommendations supplied or endorsed by TradingView. Read more in the Terms of Use.