OPEN-SOURCE SCRIPT
Special Time Period
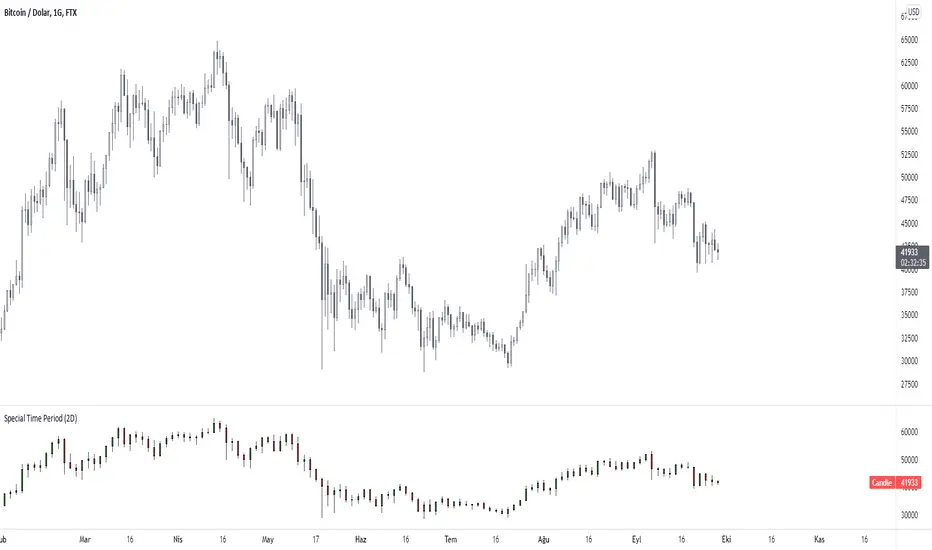
With this indicator, you can choose candles in the period you want on your chart.
How ?
• If your chart is 5 minutes, the duration should be greater than 5 on this indicator.
If you do not do it this way, there will be gaps in the price, it will not give the right result.

• If you want to see it in minutes, you must enter a direct numerical value. For example, to see 2 hours, you must enter the number 120. Because 2 hours is 120 minutes.
Like the warning above, if you want to plot a 2-hour chart with this indicator, a maximum of 1 hour should be selected on your main chart.
• Resolution, eg. '60' - 60 minutes, 'D' - daily, 'W' - weekly, 'M' - monthly, '5D' - 5 days, '12M' - one year, '3M' - one quarter
• For example, if you want to see the 2-day chart, you should have a maximum of 1 day chart open on your home screen and write "2D" to the indicator value.
• You will get much better results if the period on your main chart and the period on this indicator are multiples of each other.
• In the image below, the period on the main chart is 30 minutes, but the period on the indicator is 90

• Click on the facing brackets at the top right of the legend and your chart will enlarge.

How ?
• If your chart is 5 minutes, the duration should be greater than 5 on this indicator.
If you do not do it this way, there will be gaps in the price, it will not give the right result.
• If you want to see it in minutes, you must enter a direct numerical value. For example, to see 2 hours, you must enter the number 120. Because 2 hours is 120 minutes.
Like the warning above, if you want to plot a 2-hour chart with this indicator, a maximum of 1 hour should be selected on your main chart.
• Resolution, eg. '60' - 60 minutes, 'D' - daily, 'W' - weekly, 'M' - monthly, '5D' - 5 days, '12M' - one year, '3M' - one quarter
• For example, if you want to see the 2-day chart, you should have a maximum of 1 day chart open on your home screen and write "2D" to the indicator value.
• You will get much better results if the period on your main chart and the period on this indicator are multiples of each other.
• In the image below, the period on the main chart is 30 minutes, but the period on the indicator is 90
• Click on the facing brackets at the top right of the legend and your chart will enlarge.
Open-source script
In true TradingView spirit, the creator of this script has made it open-source, so that traders can review and verify its functionality. Kudos to the author! While you can use it for free, remember that republishing the code is subject to our House Rules.
AlgoTrade sevdası.
Disclaimer
The information and publications are not meant to be, and do not constitute, financial, investment, trading, or other types of advice or recommendations supplied or endorsed by TradingView. Read more in the Terms of Use.